The present text summarizes some mechanistic evidence regarding the interaction between protein fragments relatively resistant to digestion, the intestinal barrier, and mucosal immunity.
1. General framework
The digestion of dietary proteins generates peptide fragments that are normally further degraded and handled by the mucosal immune system without causing pathological effects.
Under physiological conditions, the intestinal barrier, immune tolerance mechanisms, and the action of the microbiota contribute to maintaining a functional balance between dietary antigen exposure and the body’s response.
When these systems are altered or particularly sensitive, some peptides relatively resistant to digestion may interact more actively with the immunological environment of the intestinal mucosa.
2. Resistant peptides and innate immunity
Some protein fragments derived from gluten have structural characteristics that slow their complete enzymatic hydrolysis. Experimental studies (in vitro and in vivo in murine models) have shown that these fragments may:
a – activate innate signaling pathways (e.g. MyD88-dependent pathways)
b – modulate the production of local inflammatory mediators
c – interact with the intestinal epithelium by influencing tight junction organization
d – in specific models, activate the NLRP3 inflammasome
It is important to emphasize that these observations derive mainly from controlled experimental models; however, they demonstrate the biological plausibility of an interaction between persistent protein fragments and mucosal immunity.
3. Intestinal permeability and functional vulnerability
The intestinal barrier represents a dynamic system regulated by:
1 – tight junctions
2 – mucus and microbiota
3 – local immune signals
In conditions of vulnerability — such as:
1 – irritable bowel syndrome
2 – chronic dysbiosis
3 – prolonged stress
4 – metabolic obesity
5 – non-intestinal inflammatory conditions associated with increased permeability
the epithelial response threshold may be altered.
In such contexts, the presence of protein fragments relatively resistant to digestion may:
1 – prolong mucosal contact
2 – promote local activation of innate immunity
3 – contribute to a low-grade pro-inflammatory environment
This is not a matter of direct causality demonstrated in healthy humans, but of plausible interactions in predisposing conditions.
4. Microbiota as a response modulator
The intestinal microbiota plays a central role in the handling of dietary proteins:
it participates in the secondary degradation of peptides
it modulates barrier integrity
it influences the local immune profile
Animal models have shown that microbial composition can amplify or attenuate the mucosal response to wheat protein components.
In humans, dietary studies show that changes in gluten intake are associated with variations in the microbiota; however, these effects are often intertwined with changes in fiber and the overall food matrix.
In subjects with dysbiosis or unstable microbial balance, the handling of persistent protein fragments may be less efficient.
5. Clinical conditions not always overt
Some individuals present with:
fluctuating gastrointestinal symptoms
unexplained chronic fatigue
mild metabolic alterations
functional intestinal disorders
In these cases, even in the absence of a structured diagnosis, there are sometimes observed:
markers of altered barrier function
increased low-grade pro-inflammatory cytokines
modifications of the microbiota
There is no robust clinical evidence demonstrating that gluten peptides are the direct cause of such conditions; however, in the presence of vulnerability, the quality of protein digestion and the burden of persistent fragments may represent a modulating factor.
6. Individual vulnerability, fermentation, and modulation of the persistent peptide load
The relationship between foods and the organism is never linear, but systemic.
The response to a dietary protein does not depend exclusively on its composition, but rather on the dynamic interaction among:
1 – the functional state of the intestinal barrier
2 – the microbiota profile
3 – the regulation of innate immunity
4 – the efficiency of digestive processes
5 – the individual metabolic and inflammatory context
In a fully healthy subject, these systems cooperate effectively in ensuring the complete handling of the protein fragments deriving from gluten digestion.
The possible presence of peptides relatively resistant to digestion does not, in itself, entail a clinically relevant disturbance.
Conversely, in the presence of vulnerabilities — genetic, immunological, metabolic, or functional — even mild alterations of the barrier or microbiota may modify the organism’s response threshold.
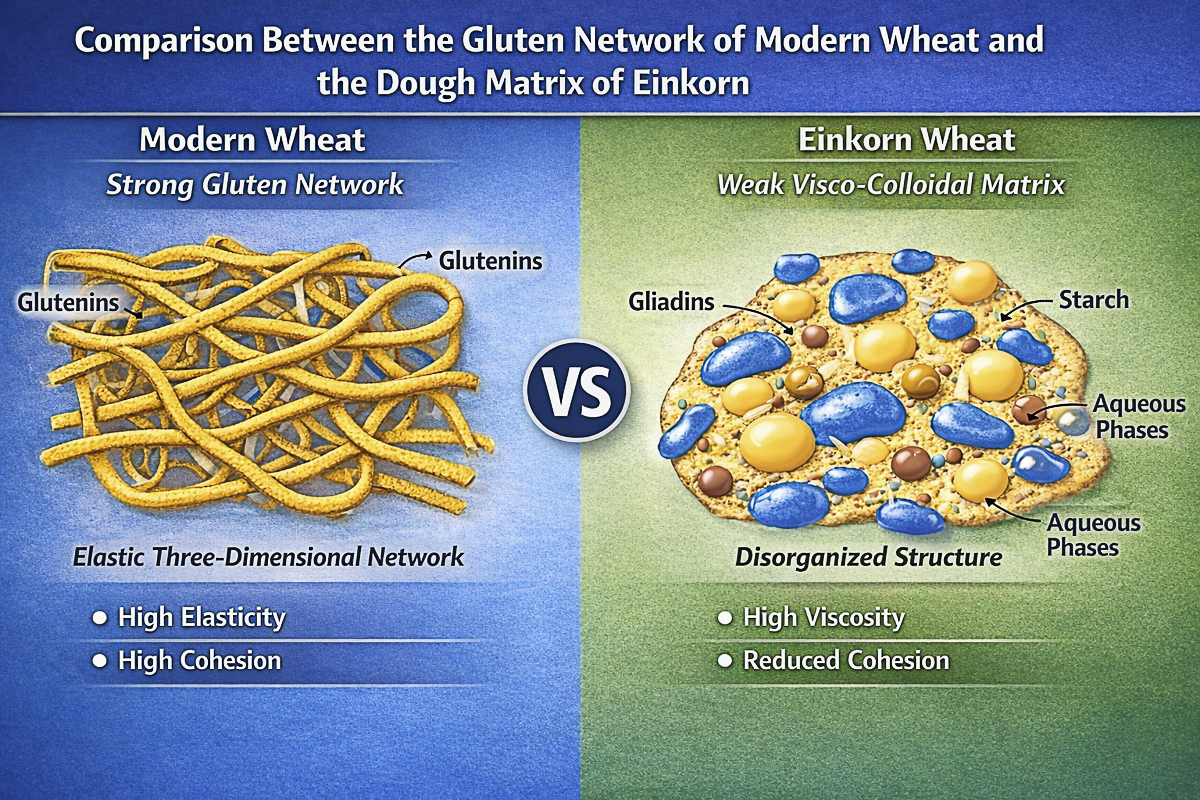
Within this framework, fermentation technology takes on relevance that goes beyond the sensory or structural aspect of the product.
Prolonged fermentation, controlled acidification, and microbial peptidase activity may:
1 – reduce the average molecular weight of protein fractions
2 – modify the peptide profile of the dough
3 – decrease the proportion of relatively persistent fragments
4 – make the protein matrix more accessible to enzymatic digestion
7. Summary of the evidence
In healthy subjects, the organism effectively regulates the response to dietary protein fragments.
In the presence of immunological vulnerability, non-specific genetic predisposition, or alterations of the mucosal barrier, the response to relatively digestion-resistant peptides may be statistically amplified.
The strongest evidence derives from experimental models; clinical data in humans remain limited.
The intestinal microbiota represents a key mediator in the modulation of these effects.
8. Prudential implication
In subjects with predisposing conditions — even if not fully manifest — a prudent nutritional approach may be justified.
Such an approach should be:
1 – personalized
2 – contextualized
3 – integrated into the overall assessment of health status
and not intended as a generalization applicable to the healthy population.
Bibliography
Scientific studies connected to the most relevant passages of the systemic concluding paragraph: interaction of digestion-resistant protein fragments with the intestinal barrier, innate immune signals, and modulation of the microbiota.
1. Intestinal barrier (paracellular opening mechanism)
Gliadin induces an increase in intestinal permeability and zonulin release by binding to the chemokine receptor CXCR3 — Alessio Fasano et al., 2008, Gastroenterology
Why it is central
This study demonstrates the molecular mechanism by which gliadin components can modulate the intestinal barrier.
Mechanism shown
gliadin → CXCR3 → MyD88 → zonulin release → tight junction opening
Why it is fundamental
it directly links dietary peptides → intestinal permeability
it identifies the receptor and the signaling pathway
it is one of the most cited studies on barrier modulation.
Role in your article
It is the foundation for the mucosal barrier / gatekeeping chapter.
2. Activation of innate immunity
Gliadin stimulation of murine macrophage inflammatory gene expression and intestinal permeability are MyD88-dependent — Steven N. Vogel et al., 2006, The Journal of Immunology
Why it is central
It demonstrates that gliadin and resistant peptides can activate innate immunity.
Mechanism shown
gliadin peptides → MyD88-dependent activation →
expression of inflammatory genes in macrophages + modulation of intestinal permeability.
Why it is important
it explains that the effect is not only on the barrier, but also on immune signaling
it directly links resistant peptides → innate immune response
Role in your article
It is the basis for the section on resistant peptides as innate immunological signals.
3. Inflammasome and mucosal damage
p31-43 Gliadin Peptide Forms Oligomers and Induces NLRP3 Inflammasome/Caspase-1-Dependent Mucosal Damage in Small Intestine — Fernando G. Chirdo et al., 2019, Frontiers in Immunology.
Why it is central
It shows that a single resistant peptide (p31-43) can activate the NLRP3 inflammasome in vivo.
Mechanism shown
p31-43 → oligomerization → activation of the NLRP3 inflammasome →
caspase-1 → IL-1β → mucosal damage
Why it is very strong
it demonstrates a complete inflammatory mechanism
it occurs in vivo in the animal model
it links peptide persistence → structured inflammatory response
Role in your article
It is the basis of the section on activation of mucosal inflammation.
Why these three form the mechanistic axis
Together they describe a coherent biological sequence:
1️⃣ Resistant peptides → intestinal barrier
(Lammers)
2️⃣ Resistant peptides → innate immunity
(Thomas)
3️⃣ Resistant peptides → inflammasome and mucosal damage
(Gómez Castro)
They therefore explain:
dietary peptide → barrier → immunity → inflammation
B. Research, studies related to the chapters
1. Intestinal barrier and permeability
1.1 Gliadin → CXCR3 → MyD88 → zonulin → ↑ permeability (murine ex vivo + human expression data)
Lammers KM et al. (2008)
Title: Gliadin induces an increase in intestinal permeability and zonulin release by binding to the chemokine receptor CXCR3
Journal: Gastroenterology
DOI: 10.1053/j.gastro.2008.03.023 (PubMed)
Model / what it measures
Murine small intestine ex vivo (intestinal segments) + permeability testing and zonulin release
Receptor validation: CXCR3 and MyD88 involvement
Key results
Gliadin (and some overlapping peptides) binds to CXCR3 and induces CXCR3–MyD88 association in the epithelium. (PubMed)
It increases zonulin release and permeability in wild-type; the effect is absent in CXCR3−/−. (PubMed)
How to translate it into the chapter
It is one of the “cleanest” demonstrations that gluten components can act as functional modulators of the barrier (paracellular opening) through innate pathways.
1.2. Barrier effect on human tissue ex vivo (TEER and permeability)
Hollon J et al. (2015)
Title: Effect of gliadin on permeability of intestinal biopsy explants from celiac disease patients and patients with non-celiac gluten sensitivity
Journal: Nutrients
DOI: 10.3390/nu7031565 (PubMed)
Model / what it measures
Human intestinal biopsies ex vivo in chamber (microsnapwell)
TEER measurement (transepithelial electrical resistance) as a proxy for barrier integrity
Key results (mechanistic)
Exposure to gliadin → worsening of barrier indices (↓ TEER / ↑ permeability) in the experimental set-up. (PubMed)
Manual-style use
Useful because it shifts the issue from murine biology alone to a measurable effect on human tissue, while still remaining an ex vivo model (therefore not “clinical”).
2. Innate immune activation by resistant peptides
2.1 Innate immunity: response to resistant peptides (MyD88, interferons, inflammasome)
Gliadin + “resistant” peptides → permeability + macrophage activation (MyD88-dependent)
Thomas KE et al. (2006)
Title: Gliadin stimulation of murine macrophage inflammatory gene expression and intestinal permeability are MyD88-dependent
Journal: The The Journal of Immunology
DOI: 10.4049/jimmunol.176.4.2512 (PubMed)
Model / what it measures
Murine macrophages + expression of inflammatory genes/cytokines
Intestinal permeability testing and zonulin release in the experimental system
Stimuli: gliadin and peptides (including 33-mer and p31–43)
Key results
Gliadin and derivatives (33-mer, p31–43) induce:
increased permeability (via zonulin)
up-regulation of inflammatory signals in macrophages
in a MyD88-dependent manner. (OUP Academic)
Message for the manual
Resistant peptides can be viewed as “signals” capable of activating innate immunity and modulating the barrier, independently of the clinical discussion on celiac disease.
2.2. p31–43 in vivo: MyD88 and type I interferons (mouse)
Araya RE et al. (2016)
Title: Mechanisms of innate immune activation by gluten peptide p31-43 in mice
Journal: Am J Physiol Gastrointest Liver Physiol
DOI: 10.1152/ajpgi.00435.2015 (PubMed)
Model / what it measures
Intraluminal administration of p31–43 in mice
Analysis: mucosal damage, cell death, inflammatory mediators
Key results
p31–43 induces mucosal alterations and inflammatory mediators; dependence on MyD88 and type I IFN, not on TLR4 in the set-up. (PubMed)
Why it is needed
It is a strong step: a single resistant peptide can activate innate circuits in vivo.
2.3. p31–43: oligomerization → NLRP3 inflammasome/caspase-1 → mucosal damage (mouse)
Gómez Castro MF et al. (2019)
Title: p31-43 Gliadin Peptide Forms Oligomers and Induces NLRP3 Inflammasome/Caspase 1-Dependent Mucosal Damage in Small Intestine
Journal: Frontiers in Immunology
DOI: 10.3389/fimmu.2019.00031 (Frontiers)
Model / what it measures
p31–43 administered to mice + histology, IFNβ, mature IL-1β
KO/inhibition experiments for NLRP3 and caspase-1
Physicochemical study: tendency of the peptide to form oligomers
Key results
The induced enteropathy is not observed without NLRP3 or caspase-1, and is reduced with a caspase-1 inhibitor. (PubMed)
The peptide shows a propensity for self-assembly/aggregation, linked to inflammasome activation. (Frontiers)
Take-home
“Digestive resistance” is not only chemical: it may favor persistence/aggregation and activate innate platforms (inflammasome).
2.4. Intracellular persistence and epithelial stress (cells + mucosa)
Luciani A et al. (2010)
Title: Lysosomal accumulation of gliadin p31-43 peptide induces oxidative stress…
Journal: Gut
DOI: 10.1136/gut.2009.183608 (PubMed)
Key results
p31–43 can accumulate in lysosomal compartments and induce oxidative stress and cellular responses in epithelial and mucosal models. (PubMed)
Utility
It adds the “cellular” level: resistant peptides may also act through stress/intracellular trafficking, not only through tight junctions.
3. Microbiota and host response modulation
3.1. Human data: microbiota, symptoms, and biomarkers (with the fiber caveat)
Diet context: microbiota, barrier, and immune interactions
Human dietary studies investigating gluten intake rarely isolate gluten itself. Changes in gluten consumption are usually accompanied by modifications in cereal composition, fiber intake, and overall dietary matrix.
What these studies measure
Human intervention or observational studies typically evaluate:
-
intestinal microbiota composition
-
microbial metabolic activity (e.g., fermentation markers)
-
gastrointestinal symptoms
-
selected metabolic or inflammatory biomarkers
Interpretative limitation
A major confounding factor in these studies is that reducing gluten intake often simultaneously modifies:
Therefore, observed microbiota changes cannot always be attributed to gluten itself.
Relevance for the present discussion
These studies are useful because they translate mechanistic hypotheses into real human physiology. However, they must be interpreted cautiously, as microbiota changes often reflect broader dietary shifts rather than the isolated biological effect of gluten-derived peptides.
3.2. Gliadin in the diet (HFD) → microbiota + barrier + immune phenotypes (mice)
Zhang L et al. (2017)
Title: Effects of Gliadin consumption on the Intestinal Microbiota and Metabolic Homeostasis in Mice Fed a High-fat Diet
Journal: Scientific Reports
DOI: 10.1038/srep44613 (PubMed)
Model / what it measures
HFD with vs without 4% gliadin for 23 weeks
“Integrated” analysis: microbiota in 3 compartments, barrier function, urinary metabolome, immune profiles in multiple tissues
Key results
Gliadin is associated with changes in microbiota composition/activity, barrier function, and immune phenotypes (in addition to metabolic parameters) in the HFD context. (PubMed)
Interpretative note (important)
It is a “stressed” model (HFD): useful for discussing aggravating factors, not for generalizing to bread/pizza “under ideal conditions.”
3.3. Gluten and barrier function in an inflammatory context: DSS colitis + diet with gluten (mice)
Menta/Alvarez-Leite et al. (2019)
Title: Wheat gluten intake increases the severity of experimental colitis and bacterial translocation by weakening of the proteins of the junctional complex
Journal: British Journal of Nutrition
DOI: 10.1017/S0007114518003422 (PubMed)
Model / what it measures
DSS-colitis + standard diet vs diet with ~4.5% wheat gluten
Outcome: colitis severity, permeability, bacterial translocation, proteins of the junctional complex
Key results
Dietary gluten worsens the picture in the presence of colitis, with increased permeability and bacterial translocation, and alterations of junctional proteins/organization. (PubMed)
Use in the manual
It is a strong example of “resistant peptides as an aggravating factor in an already compromised intestine,” without saying they are the primary cause.
4. Human dietary studies
4.1 Human data: microbiota, symptoms, and biomarkers (with the fiber caveat)
Here, more than “peptides” in the strict sense, the studies test gluten intake (or its reduction) and measure microbiota, intestinal fermentation, and symptoms. They are useful because they translate the discussion into real human physiology; however, they present a major confounding factor: changes in gluten intake are usually accompanied by changes in dietary fiber and cereal matrix composition.
4.2 Randomized crossover trial: low-gluten vs high-gluten (60 non-celiac adults)
Hansen LBS / Roager HM / Licht TR et al. (2018)
Title: A low-gluten diet induces changes in the intestinal microbiome of healthy Danish adults
Journal: Nature Communications
DOI: 10.1038/s41467-018-07019-x
What it measures
-
Shotgun metagenomics
-
intestinal fermentation (H₂ breath test)
-
gastrointestinal symptoms (bloating)
-
selected metabolic and inflammatory biomarkers
Key results
Low-gluten diet → moderate changes in the intestinal microbiome and reduced hydrogen production, accompanied by improvement in reported bloating.
The authors emphasize that these effects are likely driven largely by changes in dietary fiber composition rather than gluten itself.
No major changes were observed in systemic inflammatory markers; interpretation therefore remains cautious.
How to use it
This study supports the idea that physiological responses depend on the overall food matrix and dietary composition, not on isolated gluten alone.
4.3. Short intervention: 4 weeks of GFD in healthy volunteers (21 subjects)
Bonder MJ et al. (2016)
Title: The influence of a short-term gluten-free diet on the human gut microbiome
Journal: Genome Medicine
DOI: 10.1186/s13073-016-0295-y (SpringerLink)
Key results
Moderate taxonomic changes; more evident effects on predicted microbial pathways (many linked to carbohydrate/starch metabolism). (SpringerLink)
Selected intestinal/inflammatory biomarkers: no major “clinical” signal in healthy subjects in the short term (cautious interpretation). (SpringerLink)
Pathophysiological conclusion
Overall, the experimental evidence indicates that some gluten components and specific peptides relatively resistant to digestion can interact with intestinal physiology at multiple levels.
At the level of the mucosal barrier, these fragments may modulate paracellular permeability through innate signaling pathways, involving mediators such as CXCR3, MyD88, and zonulin.
At the immune level, some resistant peptides — particularly p31-43 in experimental models — are able to activate local innate responses, including interferon-dependent pathways and, under certain conditions, the NLRP3/caspase-1 inflammasome.
At the ecological and functional level, the microbiota appears both as a modulator of the host response to gluten and as a possible target of the effects induced by the dietary context in which gluten itself is consumed.
In human studies, the observed effects mainly concern moderate modifications of the microbiota and intestinal fermentation; however, these data must be interpreted with caution, since they often reflect concomitant variations in dietary fiber and the overall matrix of the diet, rather than the isolated action of gluten.
Concluding methodological note
These studies do not state that gluten protein fragments are in themselves pathological in the healthy subject. However, they provide biologically plausible mechanisms for how:
specific resistant protein sequences (e.g. from gluten) can activate cellular signals in the intestinal epithelium and innate immunity, (PubMed)
this activation can include changes in paracellular permeability and pro-inflammatory pathways (inflammasome), (PubMed)
the way the organism responds to these signals is influenced by individual factors (microbiota, mucosal barrier, immunological vulnerability). (PubMed)
These studies are predominantly:
model-based (in vitro / ex vivo)
in vivo in animals
based on synthetic protein fragments or fragments administered in a non-physiological manner
That is, they are not clinical studies in humans under normal dietary conditions, but rather mechanistic evidence on biological pathways that could be relevant in the context of subjects with a fragile intestinal barrier, altered microbiota, or subclinical immunological vulnerability.