Test n. 4 prova di conferma del 22-04-2026 dei risultati ottenuti con il precedente test n. 3.
Analisi completa dei risultati sperimentali, con riferimento alle fotografie, ai dati di temperatura, alla procedura compilata e al confronto con il test precedente.
1. Introduzione
Il presente lavoro prosegue la serie di prove sperimentali dedicate alla panificazione con farina integrale di grano monococco (Triticum monococcum), una materia prima caratterizzata da comportamento tecnologico diverso rispetto ai frumenti teneri moderni e da una limitata capacità di sviluppo glutinico. Nel test precedente (Test n. 3 del 10.04.2026) era stata valutata l’influenza della granulometria della frazione cruscale mediante sostituzione della crusca fine con cruschello grossolano. Il test n. 4 del 22-04-2026 assume il valore di prova di conferma, ma introduce un elemento ulteriore: il controllo della dinamica termica dell’impasto nella fase compresa tra uscita dalla cella a freddo e ingresso in forno.
L’ipotesi di lavoro è che, negli impasti integrali di monococco, la qualità finale del pane non dipenda soltanto dalla composizione della farina o dalla granulometria della crusca, ma anche dalla velocità con cui la massa attraversa la fase di riscaldamento e di transizione reologica. Il monococco integrale produce infatti impasti viscoso-plastici, poco elastici, nei quali il calore penetra lentamente e la struttura deve potersi riorganizzare durante il passaggio da impasto freddo, compatto e poco deformabile a impasto caldo, fermentativamente attivo e deformabile.
La particolare composizione proteica del monococco, con minore incidenza di polimeri di glutenina ad alto peso molecolare e diversa distribuzione delle gliadine, tende a produrre impasti meno elastici e più viscosi rispetto a quelli ottenuti da frumenti teneri moderni [Shewry & Halford, 2002; Wieser, 2007]. In questo contesto la frazione fibrosa e la sua granulometria assumono un ruolo rilevante perché modificano l’assorbimento dell’acqua, la viscosità della fase continua e la continuità della rete proteica.
2. Obiettivi del test di conferma
Premessa
I due pani sono stati realizzati nello stesso modo di quelli del test 3; la metodica di preparazione è stata identica. Differenze rispetto al test 3:
-
Differenti tempi di maturazione in cella a 5 gradi: nel test n. 3 entrambi gli impasti sono rimasti in cella a 5 C° per 24 ore. Nell’attuale test il pane “A” è rimasto in cella a 5 C° per 12 ore; il pane “B” per 20 ore.
- Differente sequenza e modalità per la lievitazione tra uscita dalla cella a 5 C° e ingresso in forno.
Il test n. 4 del 22-04-2026 aveva lo scopo di verificare se la sequenza osservata nel test precedente fosse ripetibile e di chiarire meglio il ruolo della fase di riscaldamento post-maturazione. In particolare sono stati osservati due impasti, Pane A e Pane B, derivati dallo stesso impasto finale e sottoposti alla medesima logica di maturazione (anche se con tempistica differente come precedentemente indicato) e cottura, ma con una diversa efficacia nel controllo della temperatura durante la fase di lievitazione.
Gli obiettivi specifici erano:
- verificare la stabilità dell’impasto dopo maturazione a freddo;
- monitorare la distribuzione della temperatura tra superficie e cuore dell’impasto;
- valutare l’effetto dello schiacciamento e delle manipolazioni intermedie sulla diffusione del calore;
- identificare la fase critica di transizione reologica;
- confrontare lo sviluppo finale e la struttura della mollica di Pane A e Pane B;
- stabilire se il controllo termico sia una variabile tecnologica decisiva per gli impasti integrali di monococco.
3. Materiali (vedi Appendice A, punto 1) e impostazione sperimentale
3.1 Preimpasto dopo 12 ore in cella a 17/18 °C.
Alle ore 6:30 il preimpasto (vedi Appendice A, punto 2) presentava consistenza pastosa ma leggermente grumosa, probabilmente in relazione alla presenza di frazione cruscale grossolana. Il profumo risultava presente e pulito; il volume appariva aumentato in modo moderato, con fermentazione percepibile ma non eccessiva. La temperatura del preimpasto era pari a 17,6 °C in superficie e 18,2 °C all’interno.
Questi dati indicano un preimpasto attivo ma non sovrafermentato, coerente con una maturazione utile alla successiva lavorazione. La presenza di una lieve granulosità non è stata interpretata come difetto, ma come possibile effetto della diversa dimensione delle particelle fibrose disperse nella matrice.
3.2 Impasto finale e divisione
Alle ore 7:00 l’impasto finale (vedi Appendice A, punto 3) presentava temperatura superficiale pari a 18,6 °C. L’impasto è stato diviso in due masse destinate a Pane A e Pane B. Il peso teorico era identico, mentre dalle misurazioni effettive si sono ottenuti 1576 g per Pane A e 1563 g per Pane B. La temperatura interna finale non è stata rilevata, poiché la temperatura superficiale era già superiore a 18 °C e la temperatura ambiente era pari a circa 24 °C.
Questo punto è rilevante perché la temperatura iniziale dell’impasto finale condiziona fortemente il comportamento successivo. L’obiettivo ideale sarebbe mantenere l’impasto finale sotto i 18 °C, preferibilmente intorno a 17-17,6 °C, per rallentare l’avvio fermentativo e consentire una maturazione più controllata.
3.3 Maturazione in cella fredda
Dopo la maturazione a freddo, i due impasti hanno mostrato un comportamento non identico. Pane A presentava crescita limitata e massa ancora compatta; Pane B mostrava invece un volume aumentato in modo più evidente, verosimilmente per una temperatura interna più alta o per una maggiore attività fermentativa durante la permanenza in cella. Entrambi gli impasti hanno comunque mantenuto la tenuta della massa, senza collasso evidente. Nell’attuale test il pane “A” è rimasto in cella a 5 °C per 12 ore; il pane “B” per 20 ore.
4. Procedura post-maturazione: dalla cella al forno
La fase di lievitazione è stata condotta rovesciando l’impasto dalla ciotola di maturazione a freddo, a circa 5 °C, su un piano caldo ricoperto da tappetino in silicone leggermente unto con olio di oliva. Poiché l’impasto iniziale aveva altezza di circa 15 cm e il calore penetra lentamente in questo tipo di massa viscoso-pastosa, l’impasto è stato schiacciato fino a circa 5 cm di spessore. L’obiettivo era aumentare la superficie di scambio e ridurre il percorso di diffusione del calore verso il centro.
L’impasto è stato coperto con una ciotola per preservare la superficie superiore. Ogni 30 minuti, per le prime due ore, sono state effettuate pieghe e capovolgimenti, allo scopo di diffondere il calore in modo più uniforme. La terza ora è stata dedicata alla manipolazione in forma di filone e al successivo riposo senza ulteriori interventi. Al termine, la pagnotta è stata formata ripiegando i lembi dell’impasto, dopo leggero schiacciamento a quadrato, senza sigillare completamente i lembi. Questa modalità è stata adottata per permettere, durante la cottura nel contenitore rovesciato, l’apertura libera dei lembi per effetto della dilatazione laterale e dell’oven spring.
La procedura di schiacciamento e successive pieghe dell’impasto sono state – come detto precedentemente- introdotte con questo test.
5. Dati termici e osservazioni
5.1 Pane A
| Orario | Temp. sopra (°C) | Temp. in mezzo (°C) | Temp. piano caldo (°C) | Superficie / note | Fase |
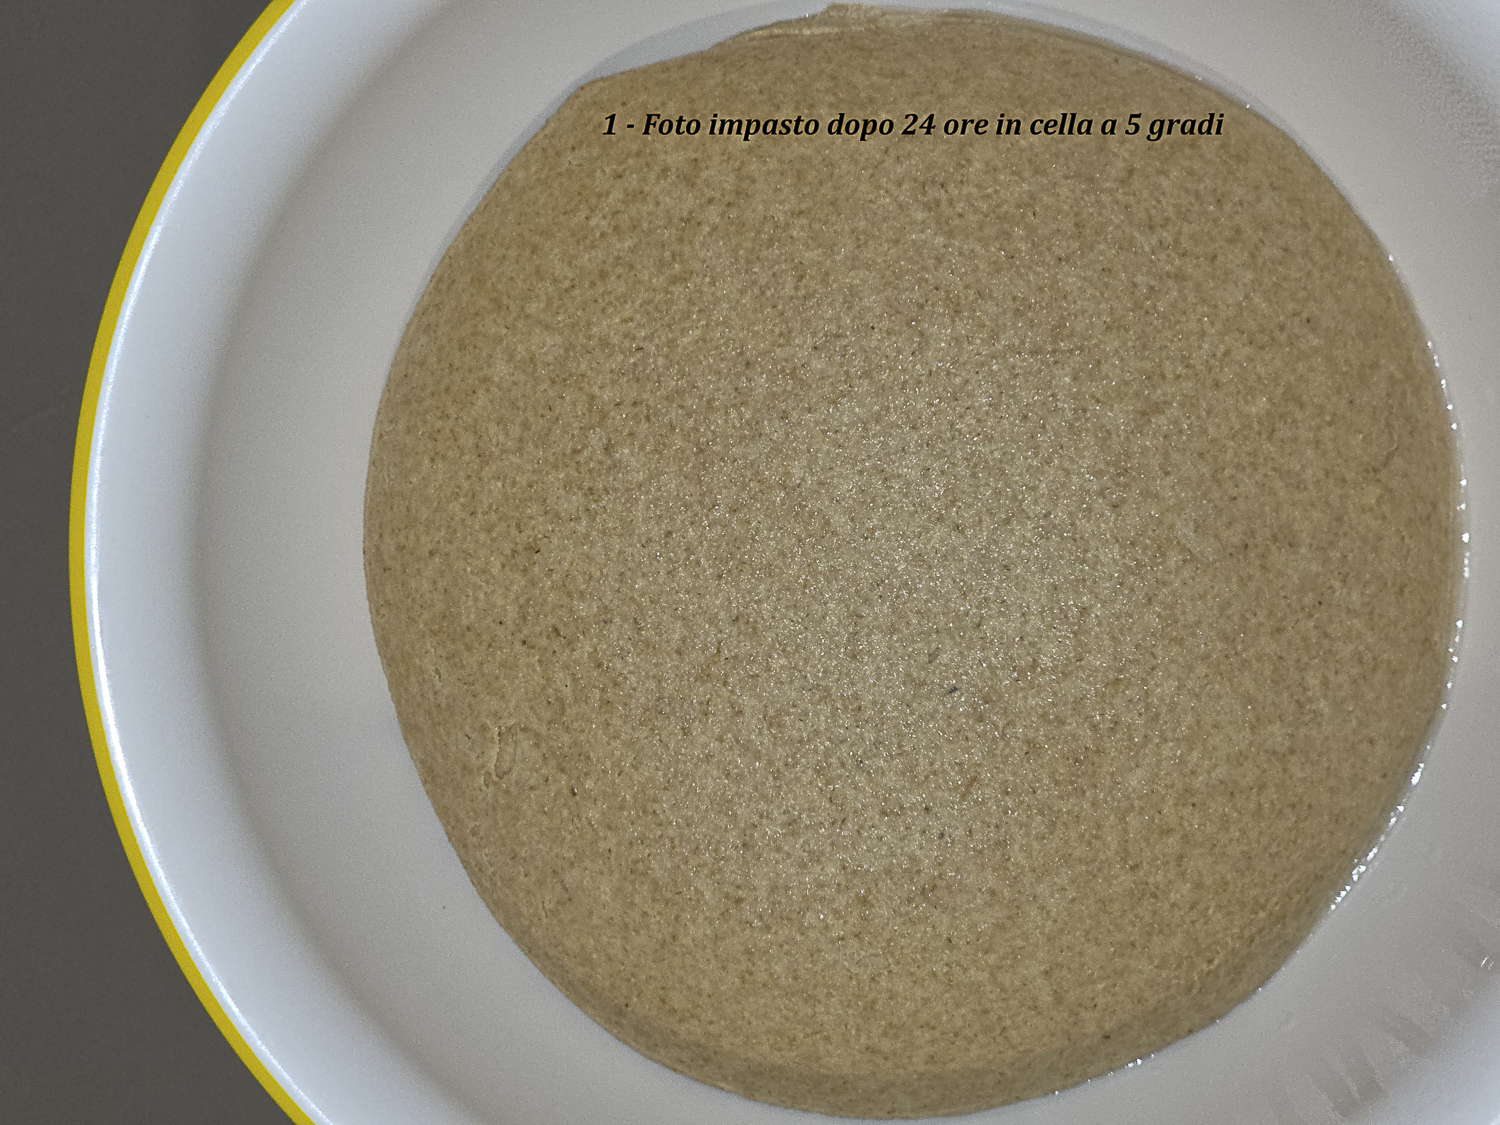
| 19:00 | 5,0 | 2,4 | 20 | Superficie compatta liscia. Foto 1 Pane A | Uscita dalla cella (freddo) |
| 19:30 | 9,2 | 7,2 | 24 | Abbastanza omogenea | Riscaldamento e prima piega |
| 20:00 | 13,0 | 12,2 | 24 | Abbastanza omogenea | Pieghe e riscaldamento progressivo |
| 20:30 | 16,0 | 15,0 | 24 | Abbastanza omogenea | Pieghe e riscaldamento progressivo |
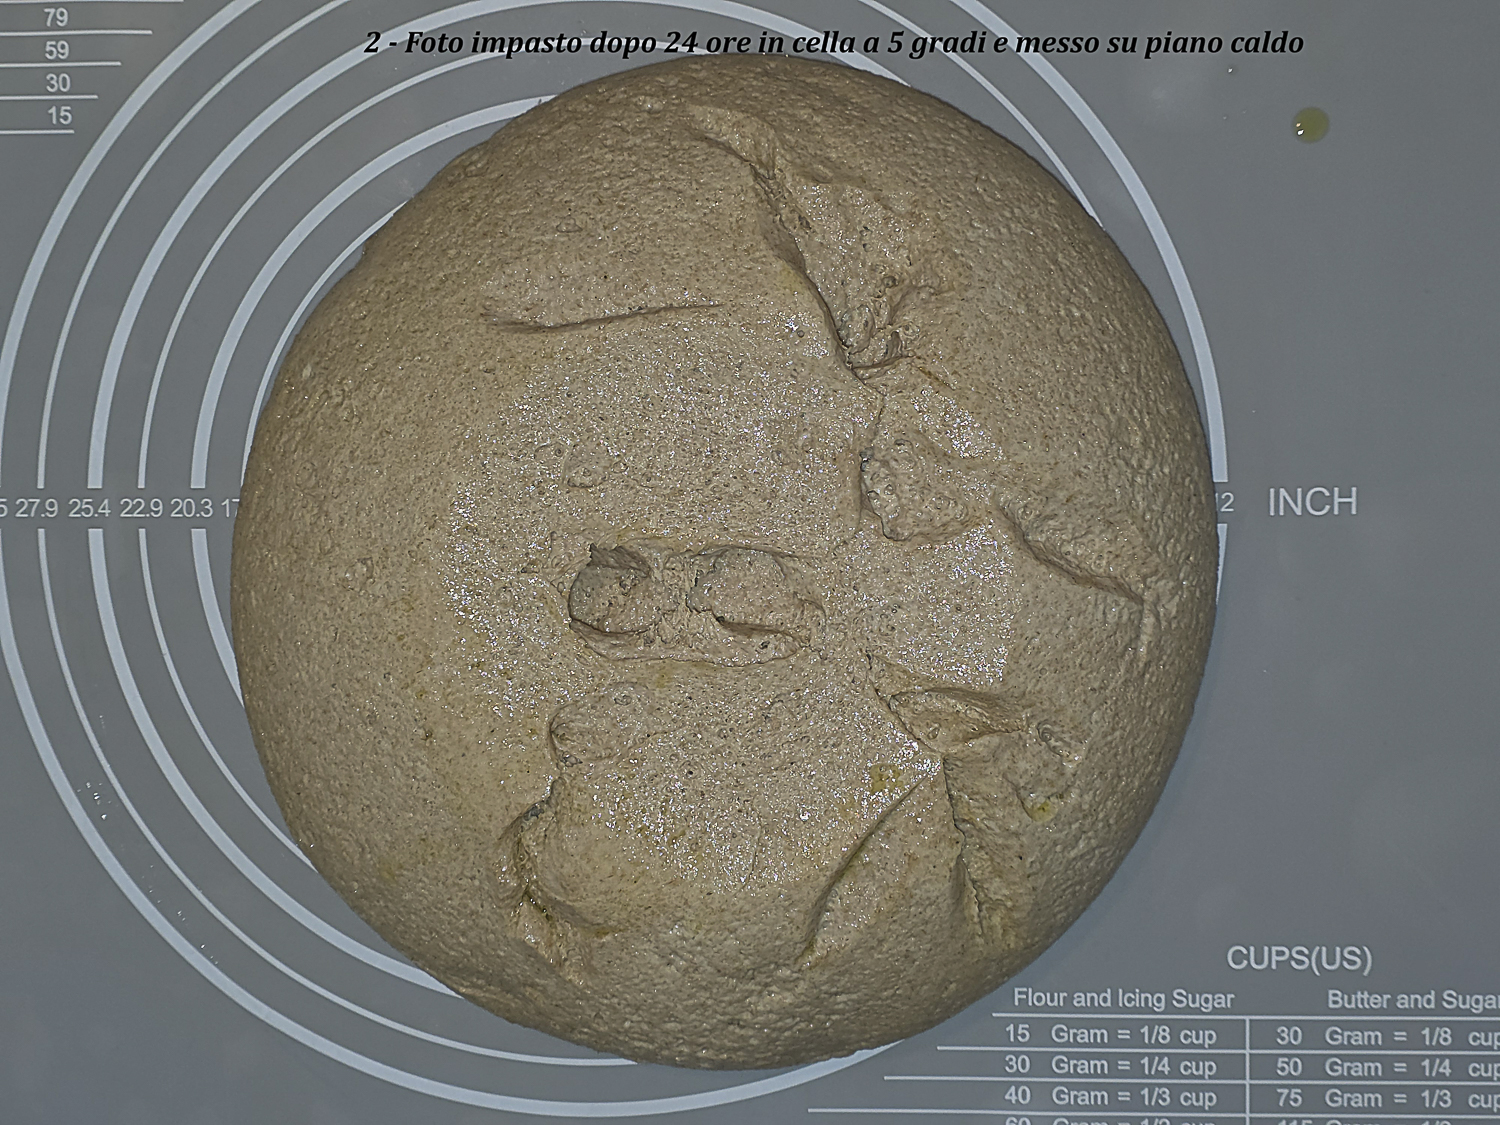
| 21:00 | 18,0 | 17,2 | 25 | Omogenea con cenni di rotture. Foto 2 Pane A | Fine pieghe |
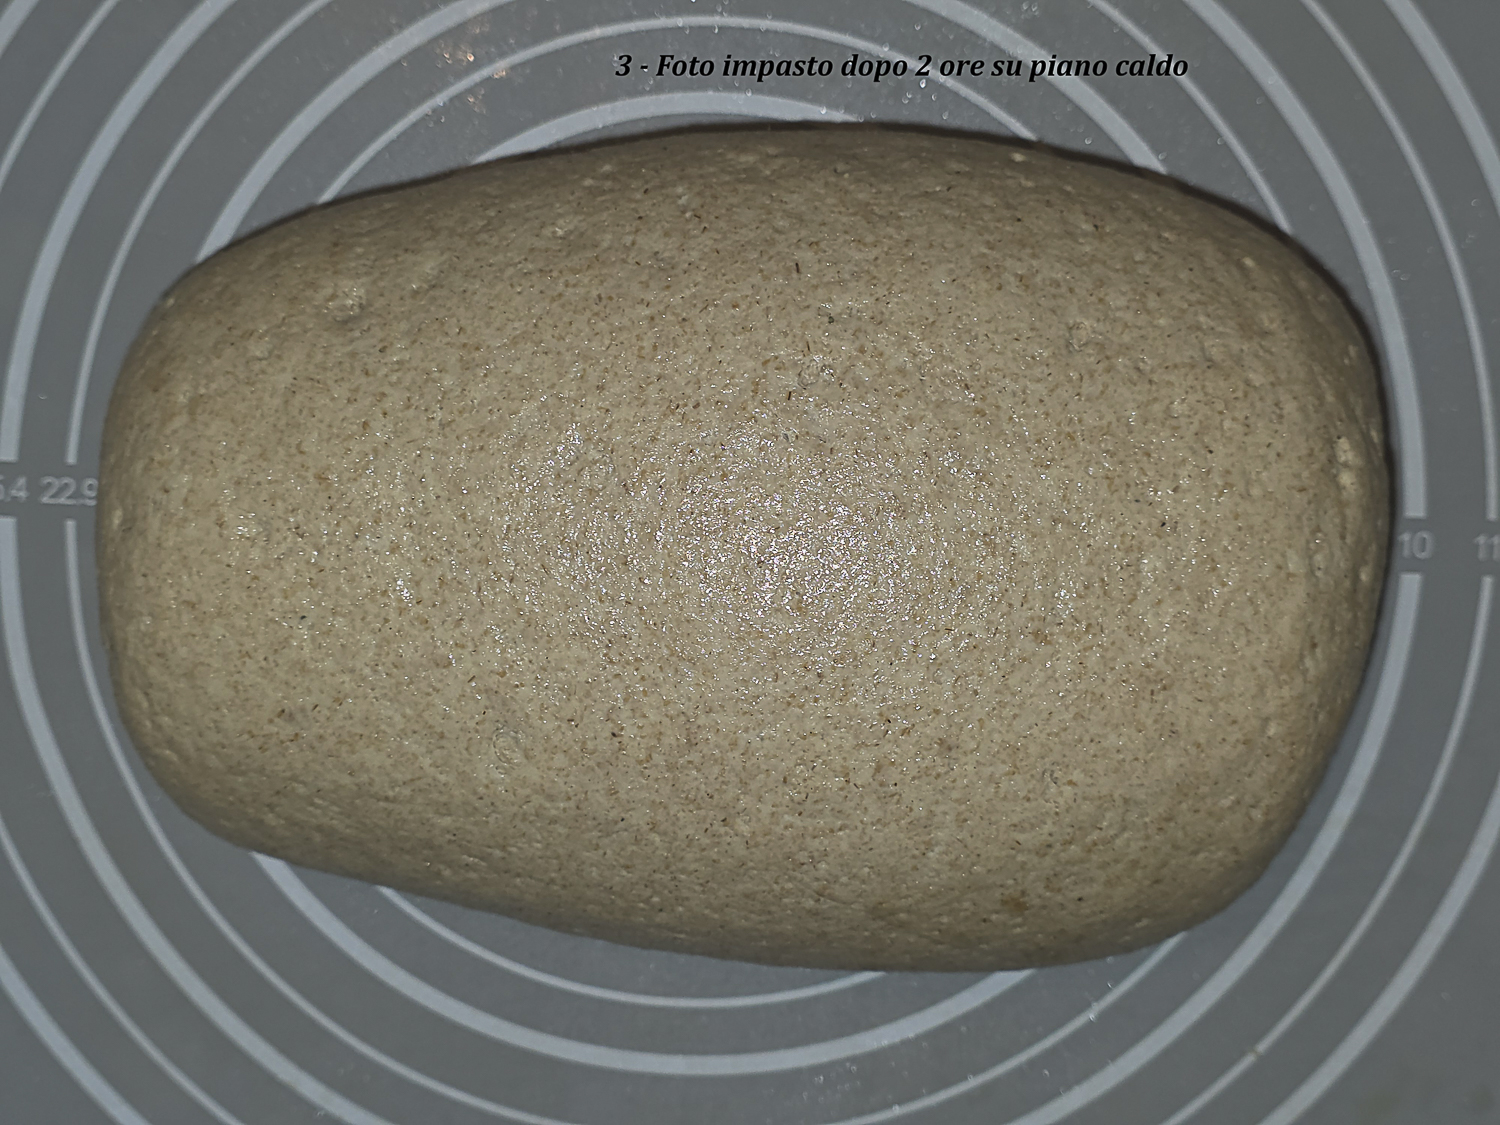
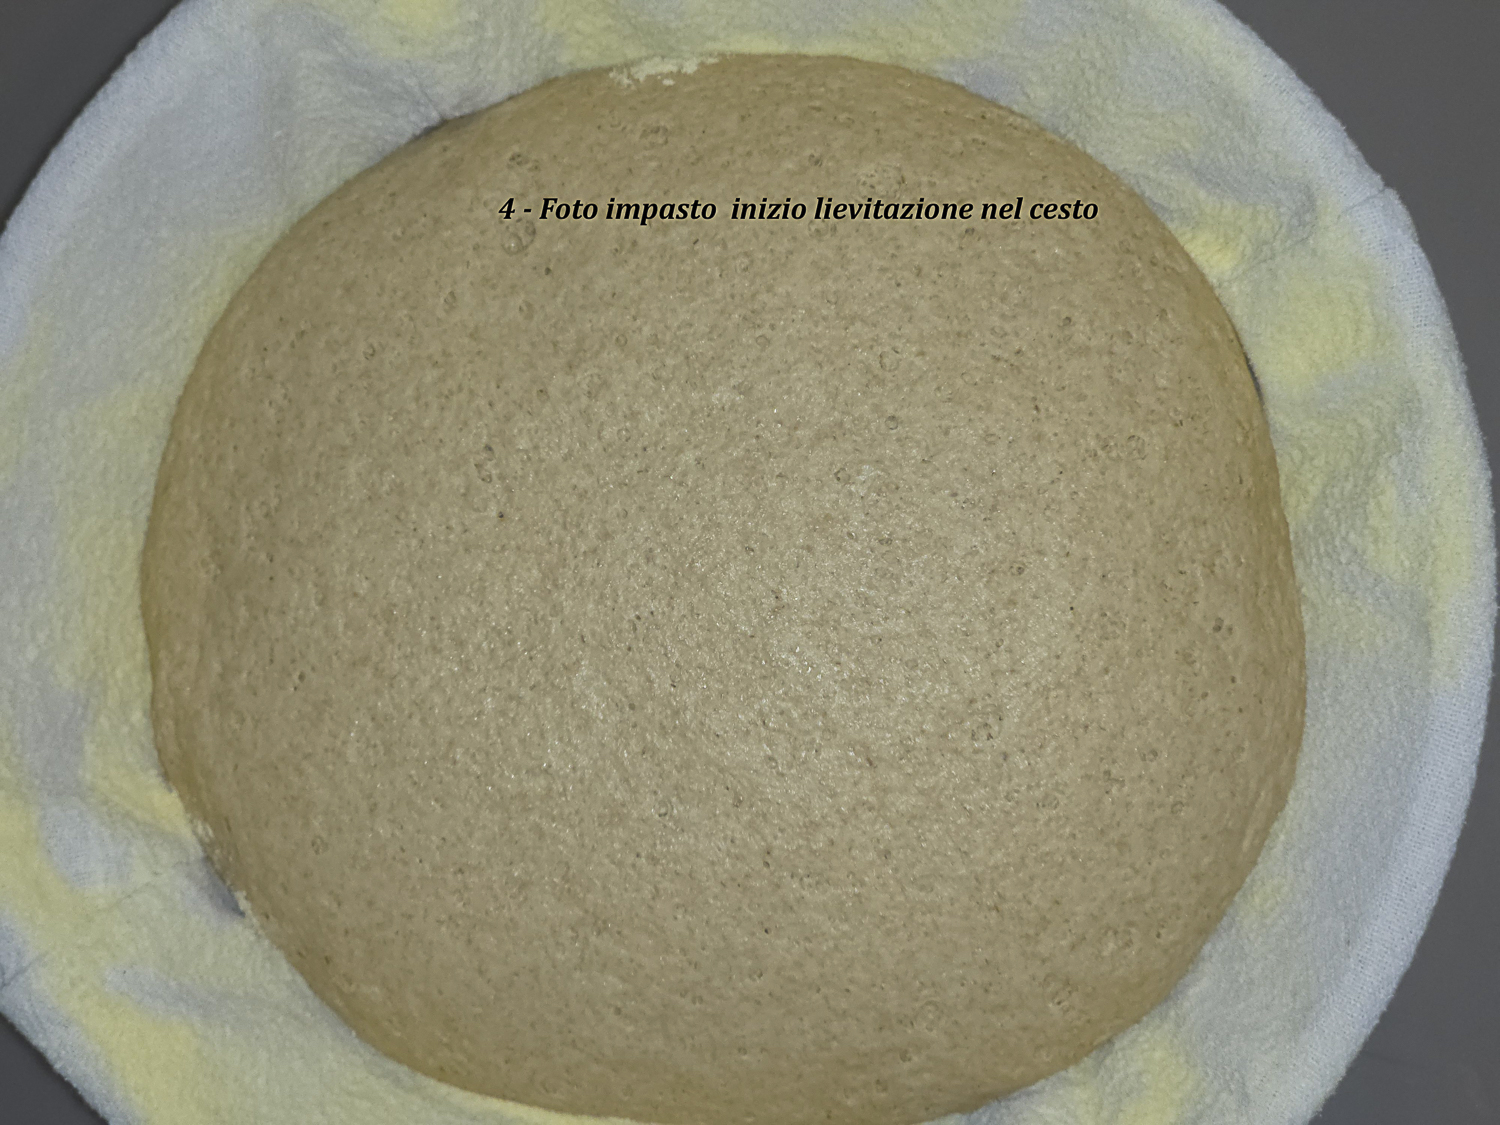
| 22:00 – cestino | 20,0 | 20,6 | 30 | Abbastanza omogenea con poche rotture ma senza collasso. Foto 3 fine lievitazione su piano caldo. Dopo formatura e posa nel cestino la superficie rimane sostanzialmente come in Foto 3. Foto 4 Pane A inizio lievitazione | Formatura e lievitazione in cestino |
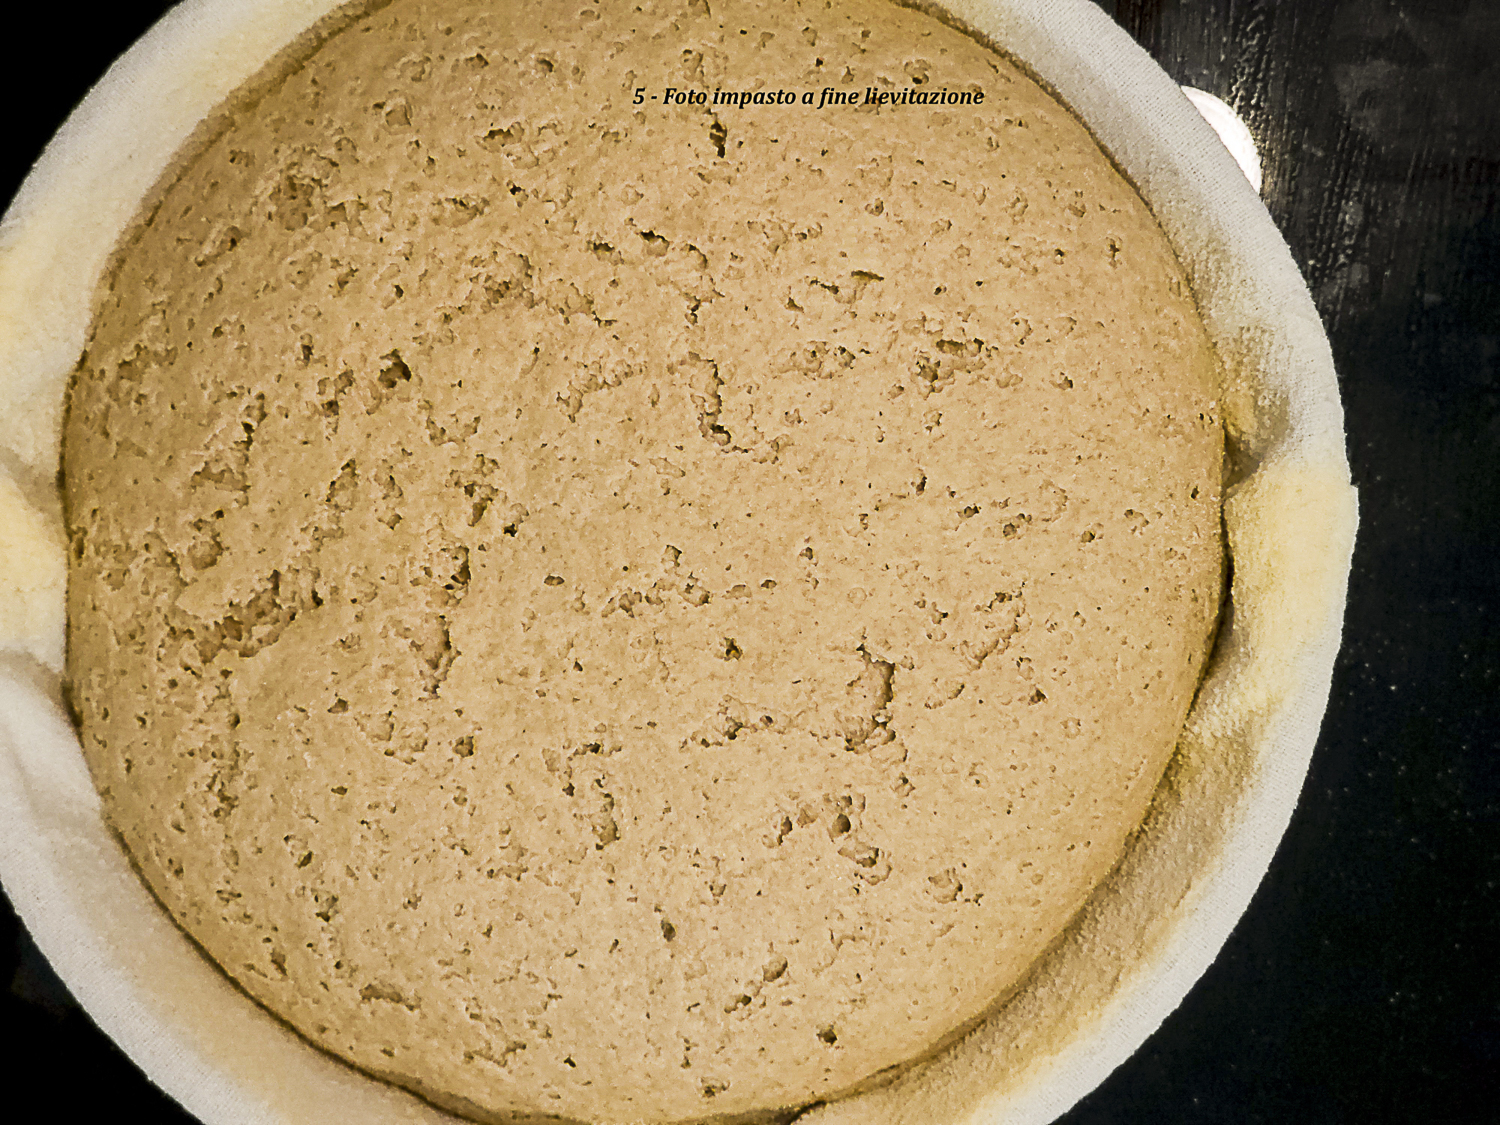
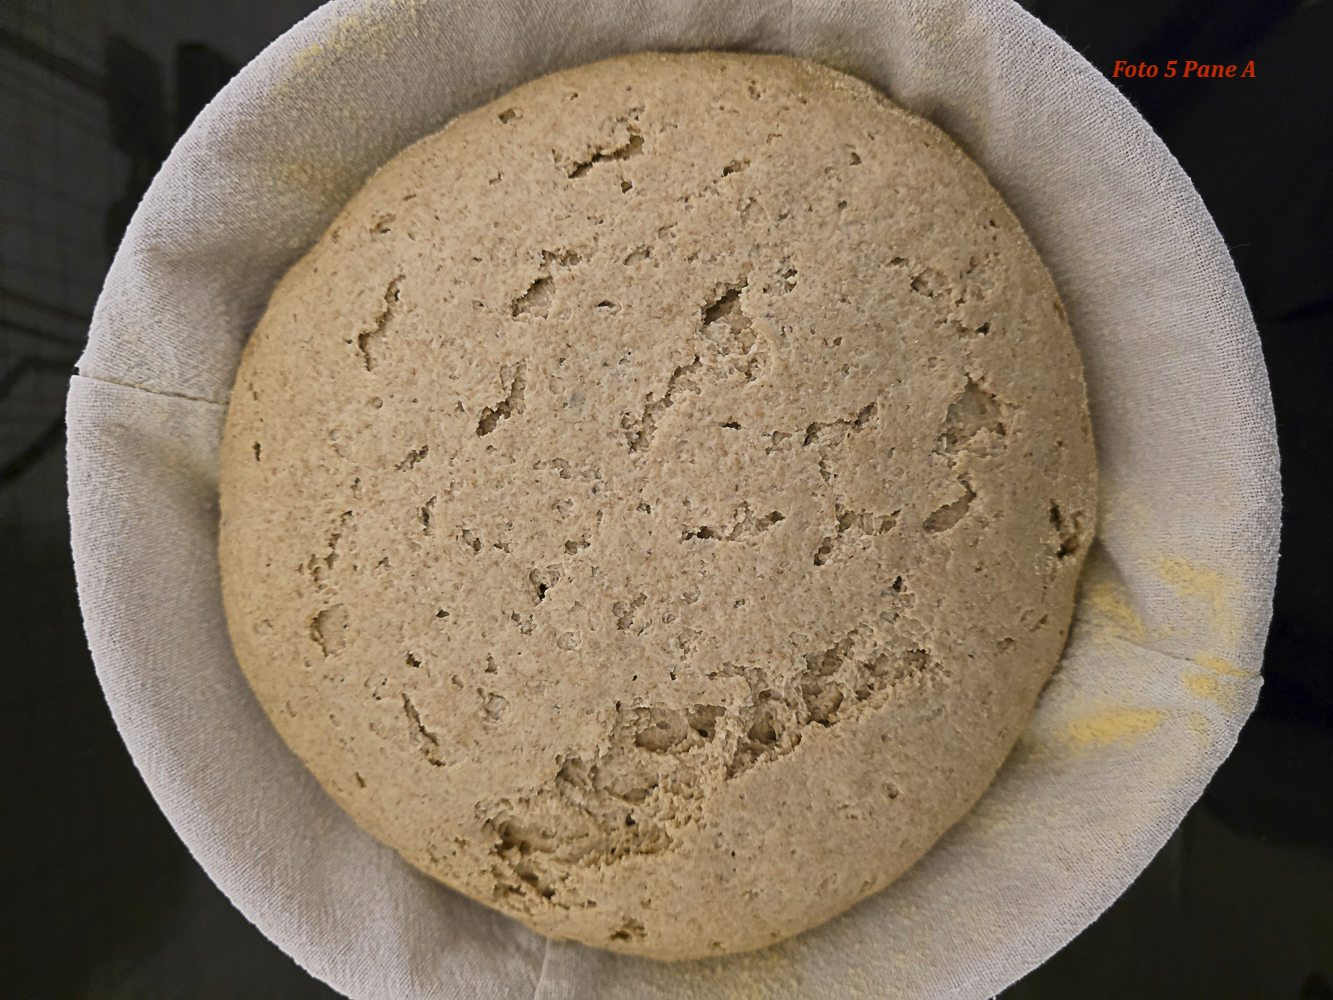
| 23:00 – prima di infornare | 21,0 | 23,8 | – | Molto disomogenea con evidenti rotture ma senza collasso. L’impasto mantiene sfericità. Foto 5 Pane A fine lievitazione | Fine lievitazione prima di infornare |
Nel Pane A il riscaldamento è risultato progressivo. La temperatura del cuore dell’impasto ha recuperato gradualmente il divario rispetto alla superficie, passando da 2,4 °C a 20,6 °C al momento dell’ingresso nel cestino e arrivando a 23,8 °C prima dell’infornata. La superficie ha mostrato rotture crescenti, ma la massa non ha collassato e ha mantenuto una geometria sostanzialmente sferica.
Foto 1 – Pane A in uscita dalla cella a freddo: superficie compatta e liscia.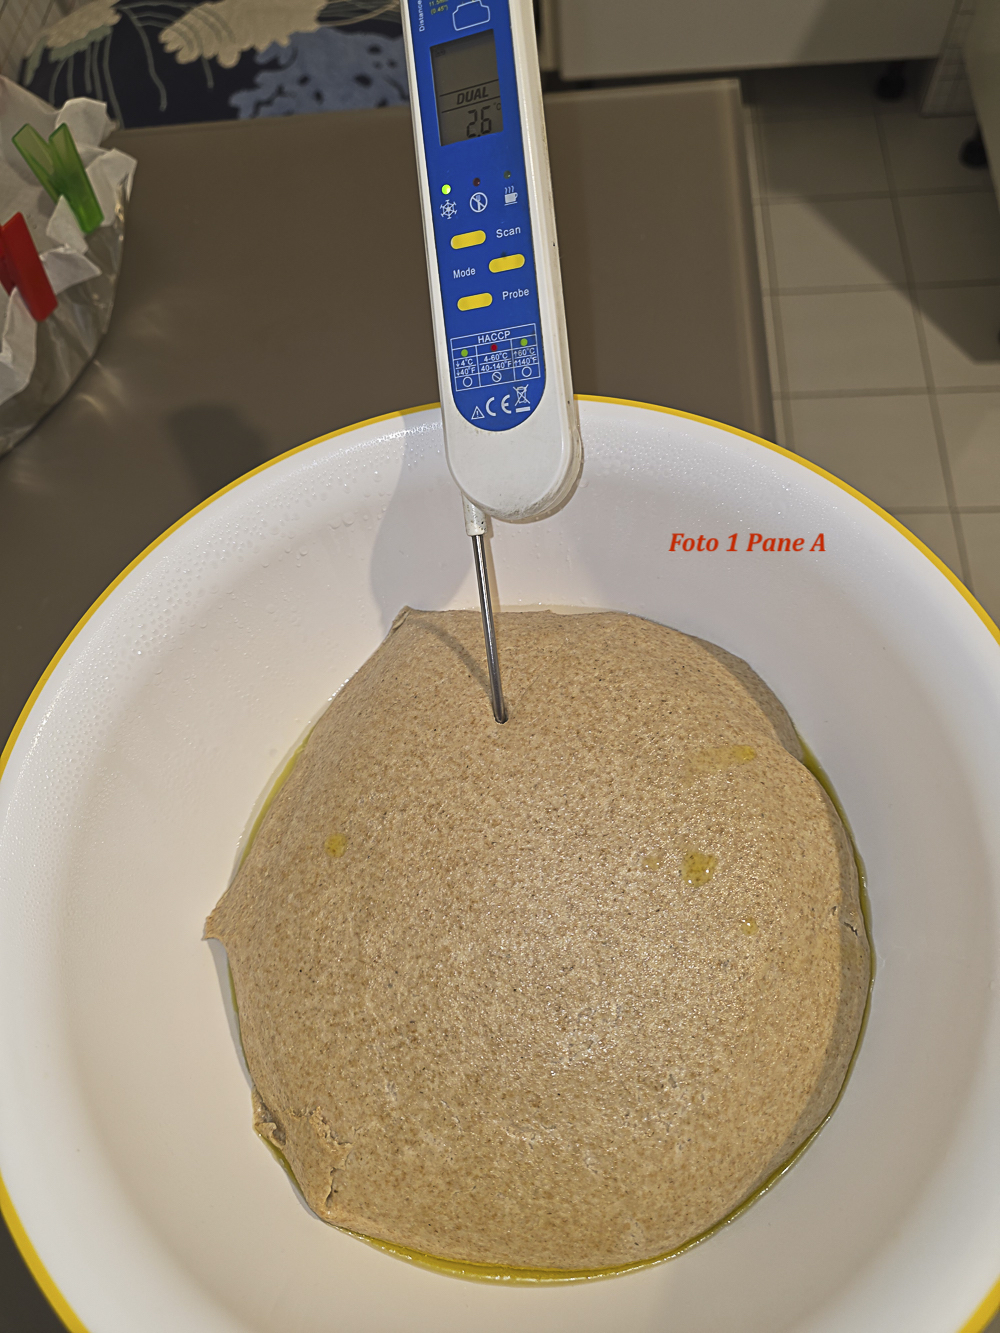
Foto 2 – Pane A dopo circa due ore su piano caldo: superficie ancora abbastanza omogenea con primi cenni di rottura.
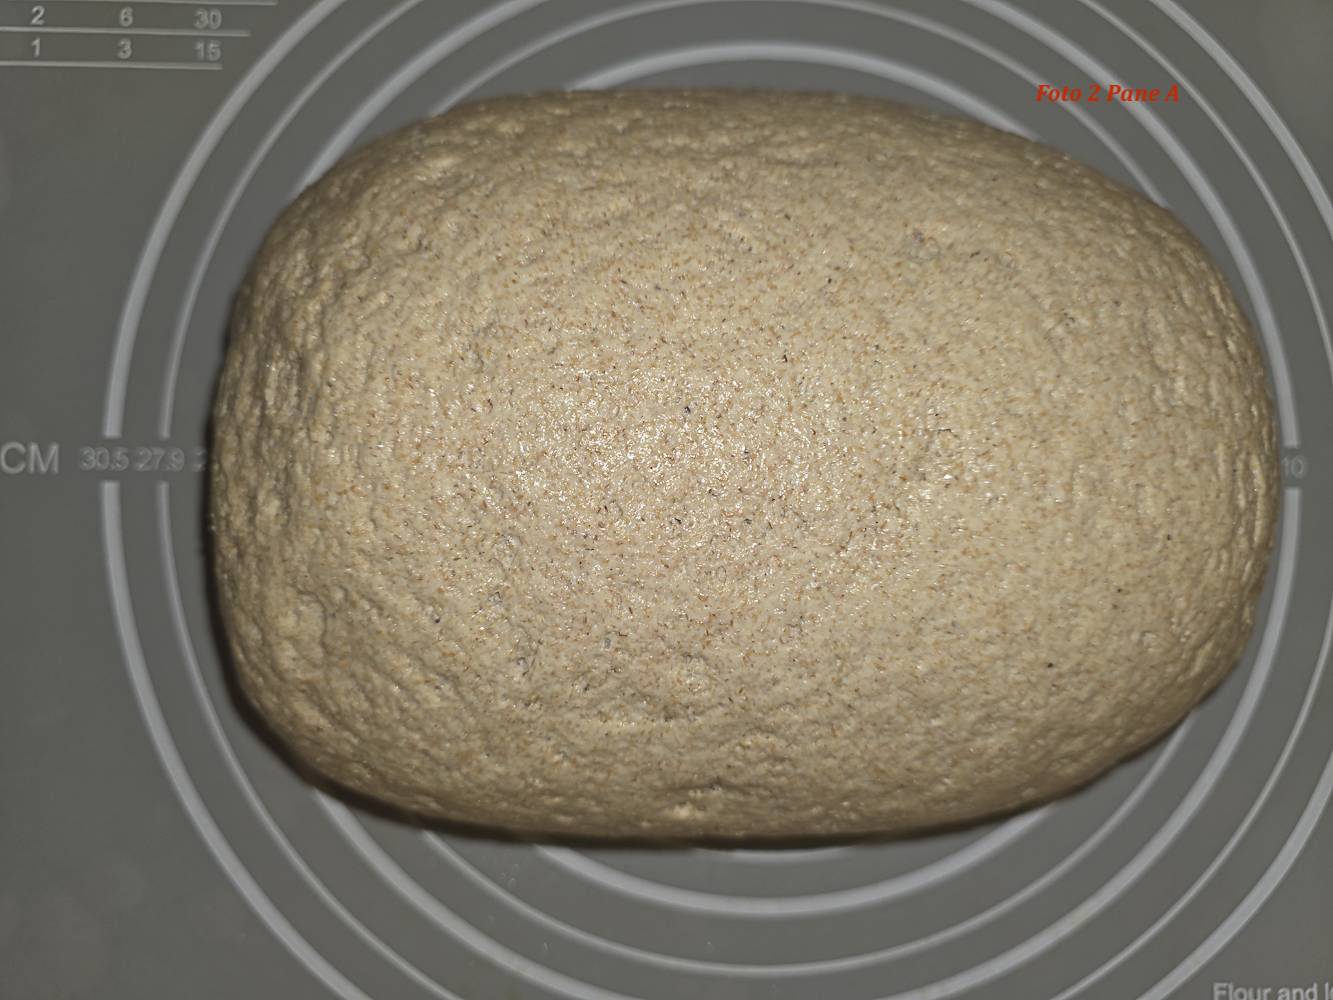
Foto 3 fine lievitazione su piano caldo
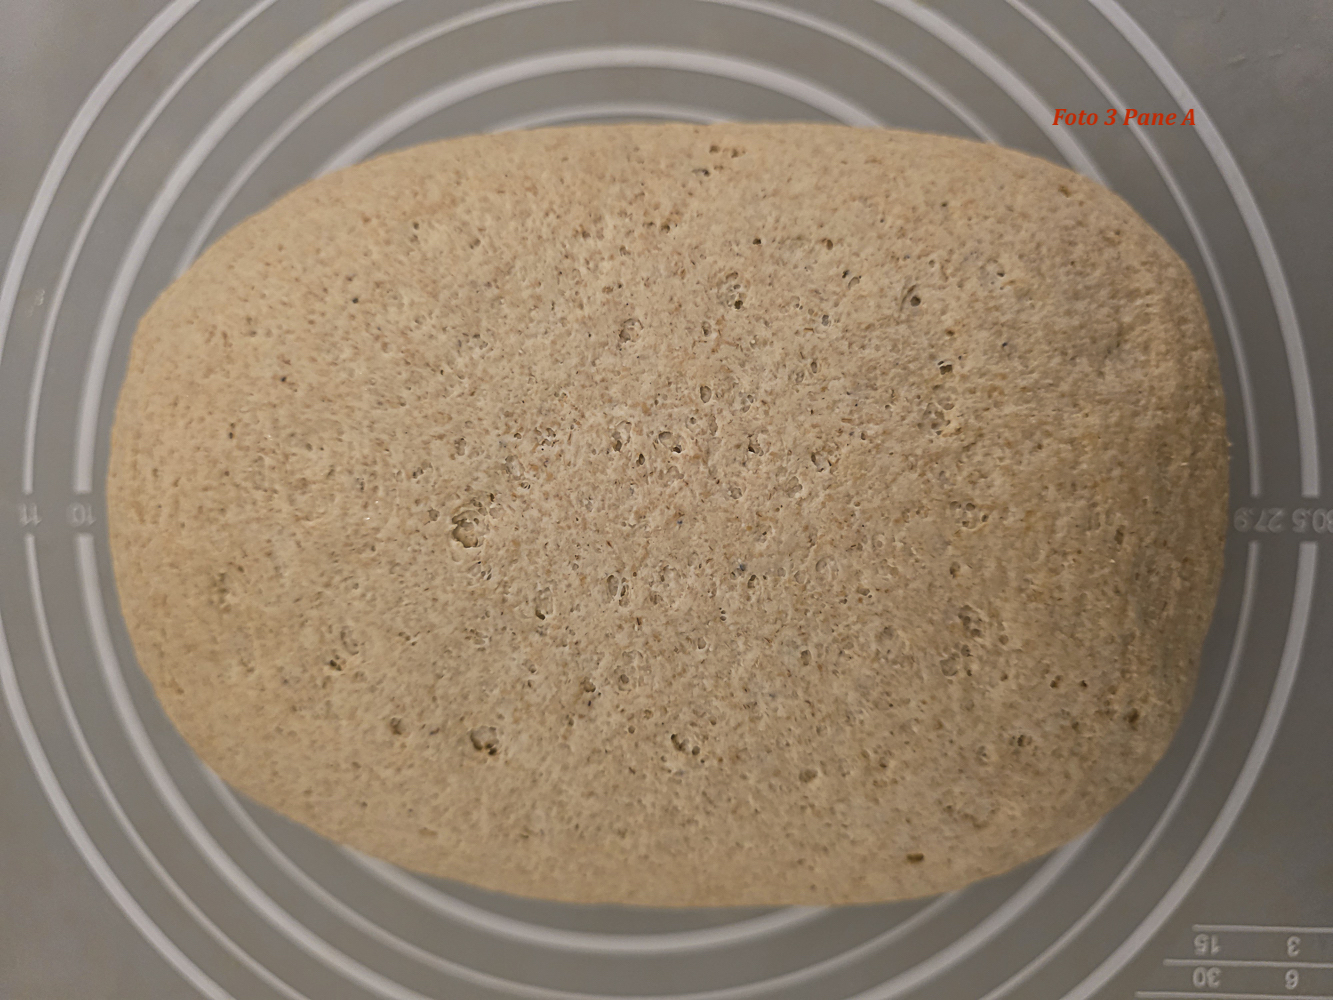
Foto 4 Pane A inizio lievitazione
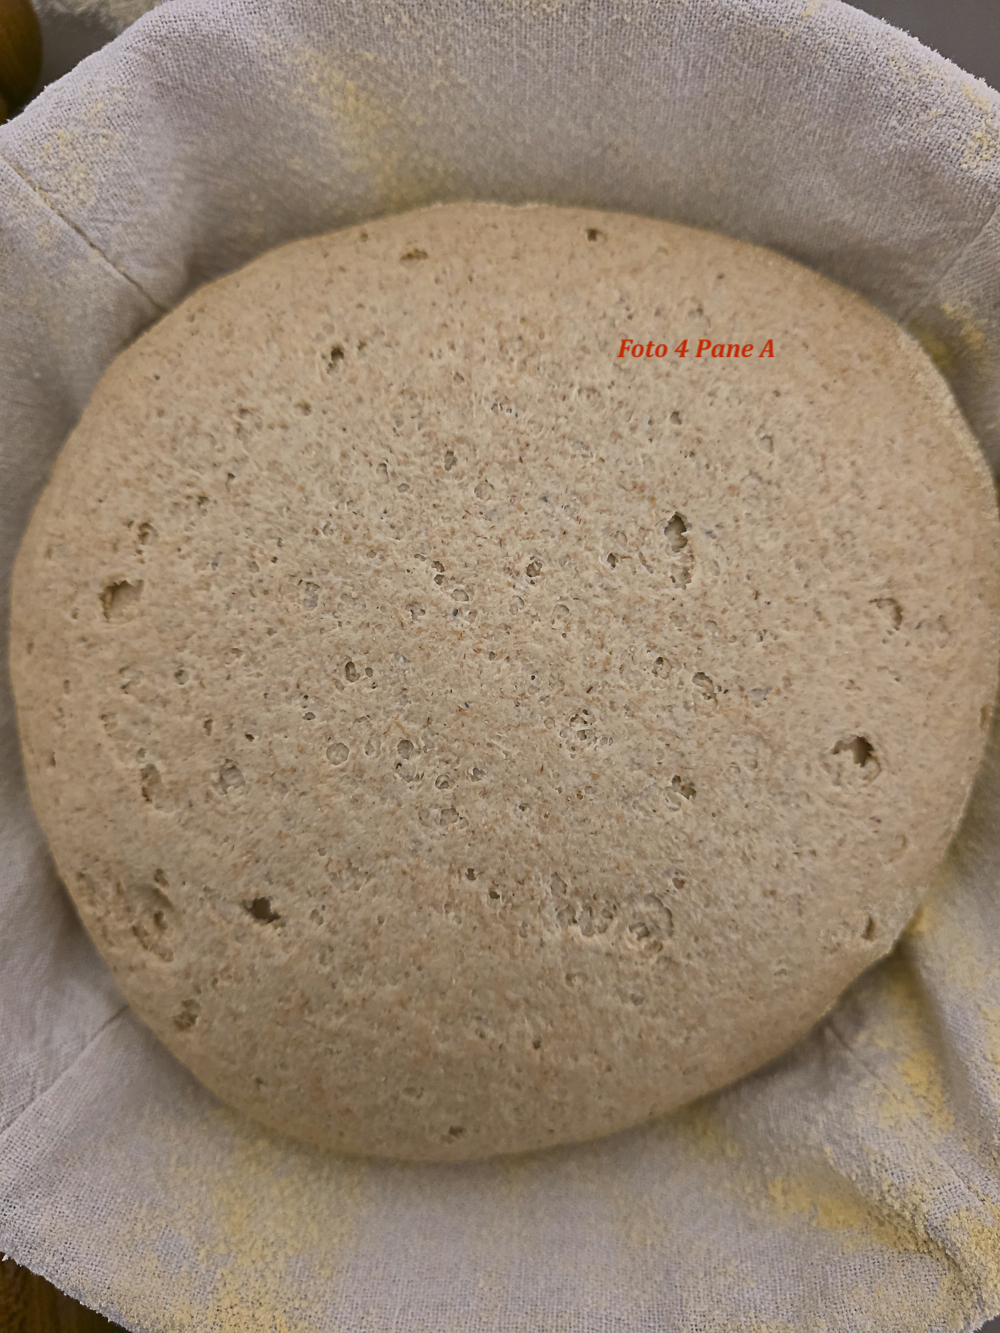
Foto 5 – Pane A a fine lievitazione nel cestino: rotture superficiali evidenti, ma assenza di collasso.
5.2 Pane B
| Orario | Sopra (°C) | In mezzo (°C) | Piano caldo
(°C) |
Superficie / note |
| 04:00 | 7,8 | 4,6 | Superficie
compatta liscia. |
Superficie compatta liscia. |
| 04:30 | 10,4 | 10,2 | 23 | Abbastanza omogenea |
| 05:00 | 15 | 14,6 | 23 | Abbastanza omogenea |
| 05:30 | 18,6 | 18,8 | 25 | Abbastanza omogenea |
| 06:00 | 20 | 21 | 25 | Disomogenea |
| 07:00 (cestino) | 21,4 | 22 | 30 | Molto disomogenea |
| 08:00 (prima
infornare) |
22 | 24,6 | – | Molto disgregata |
Nel Pane B il recupero termico è stato più rapido e meno controllato. La temperatura interna ha raggiunto e superato la temperatura superficiale già nella fase intermedia, e prima dell’infornata il cuore era a 24,6 °C, mentre la superficie era a 22 °C. La superficie è passata da omogenea a disomogenea e infine a molto disgregata. Questo andamento suggerisce un attraversamento troppo rapido della fase critica di transizione reologica.
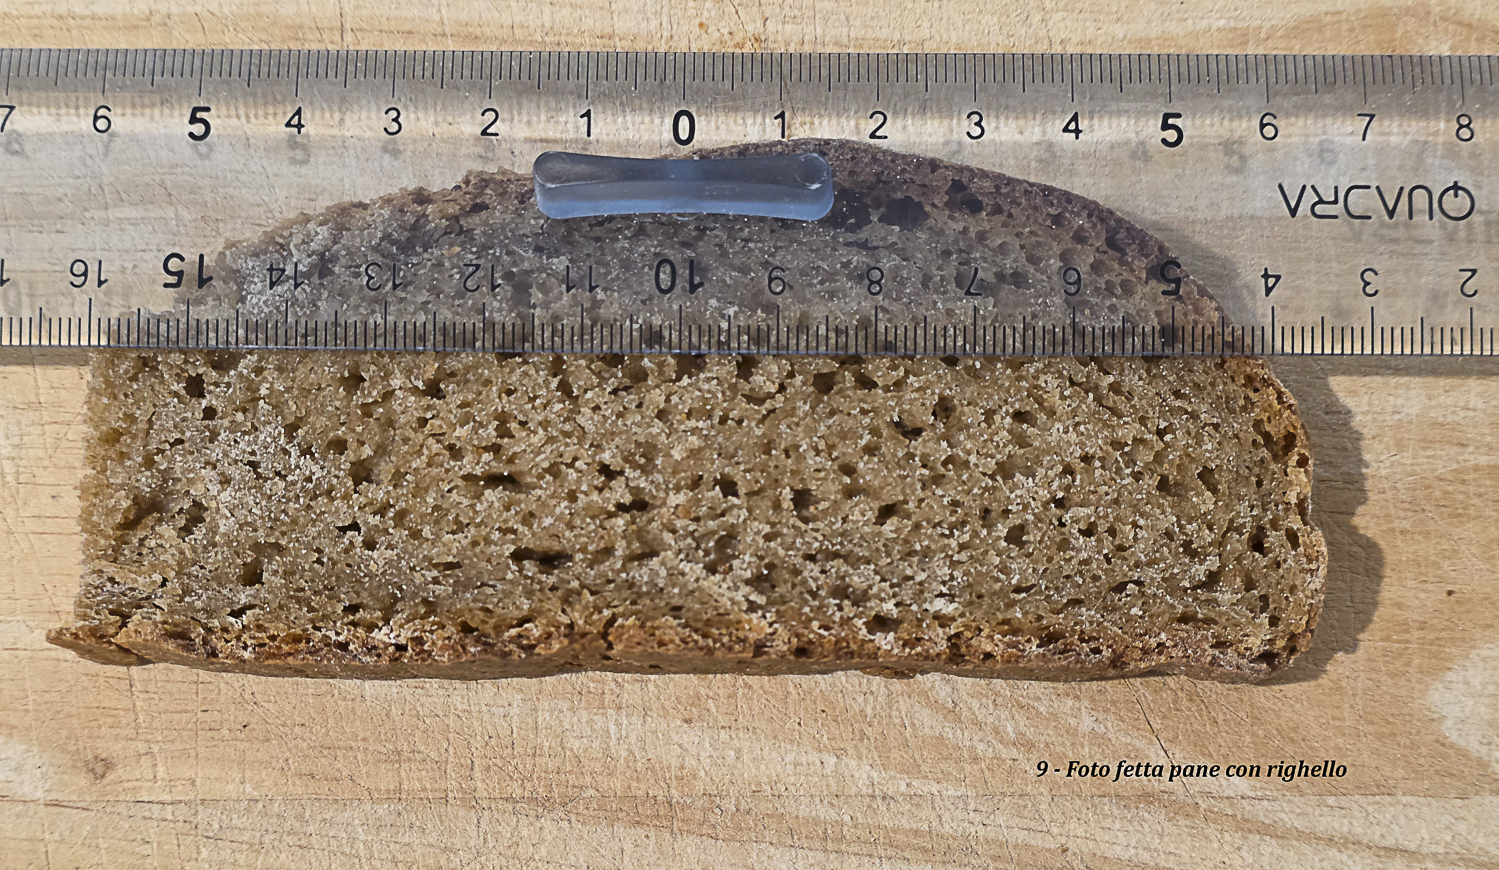
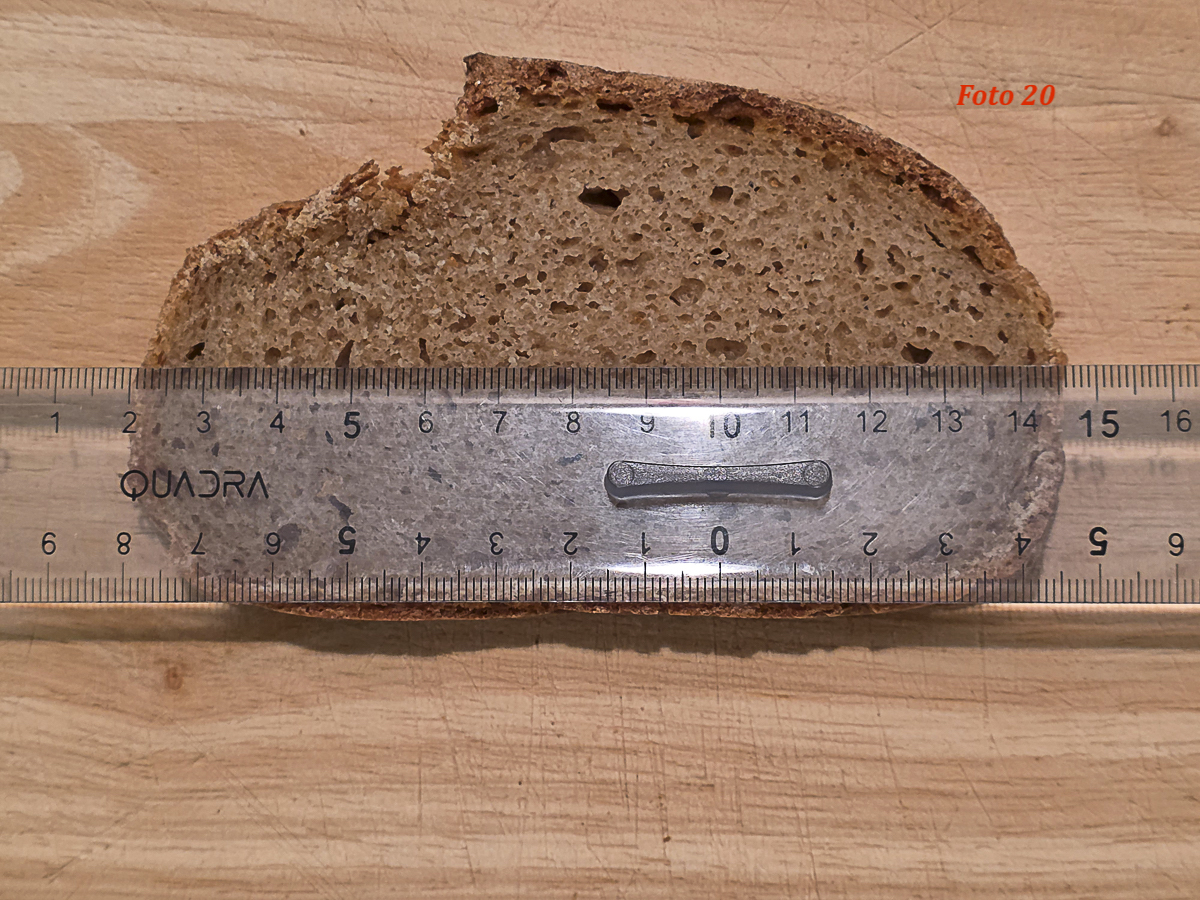
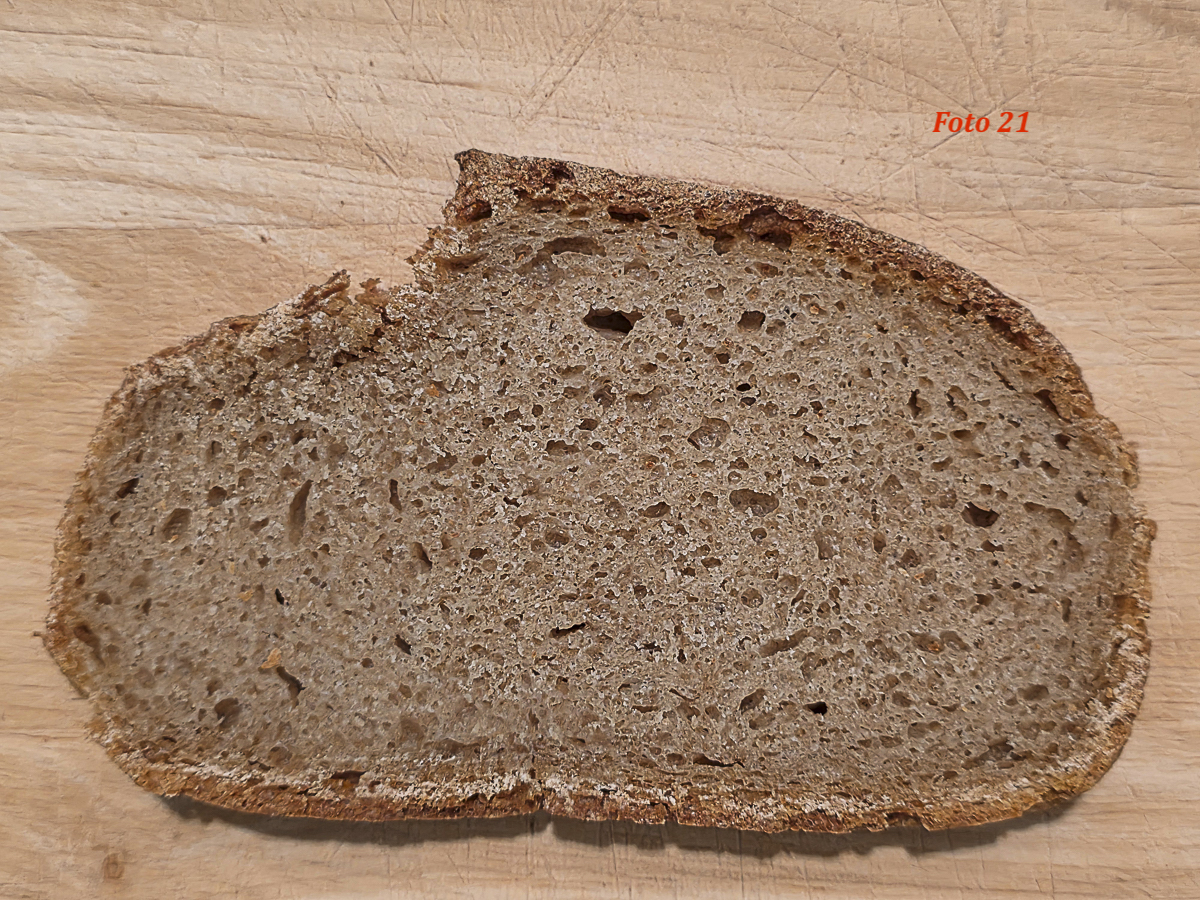
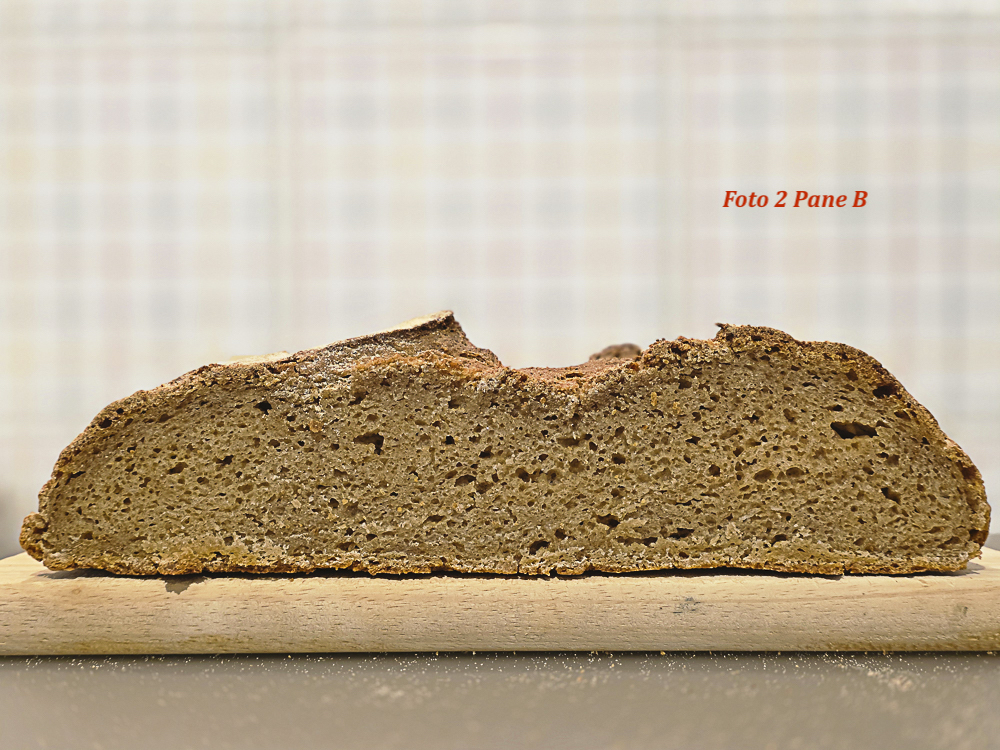
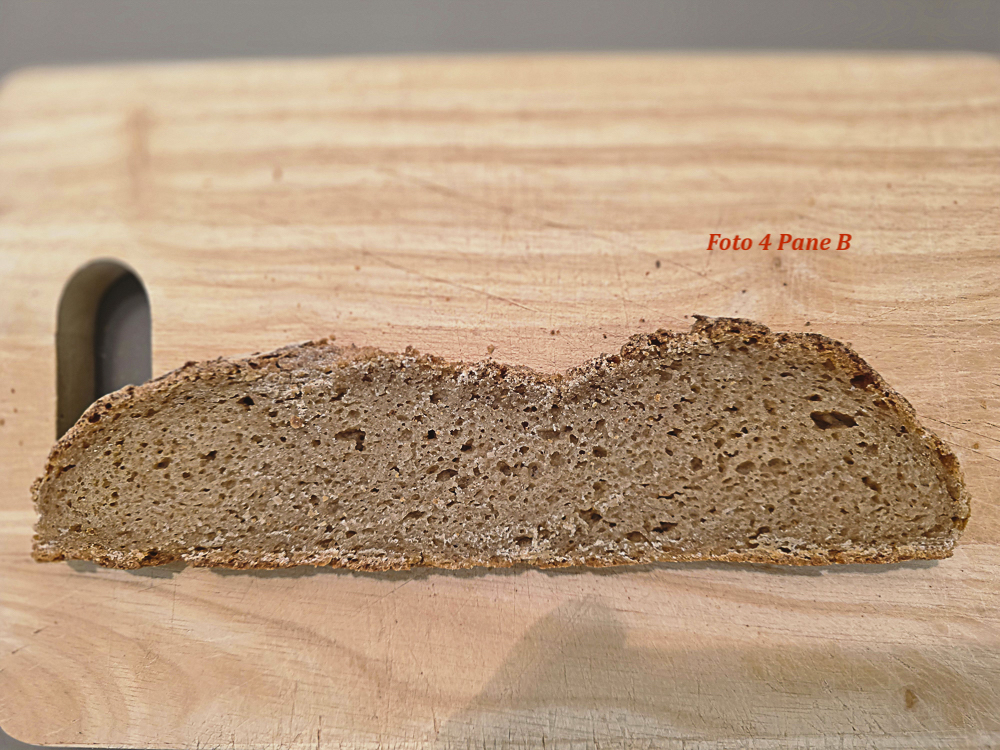
Foto 1 Pane B – Fetta con righello: sviluppo inferiore rispetto a Pane A.
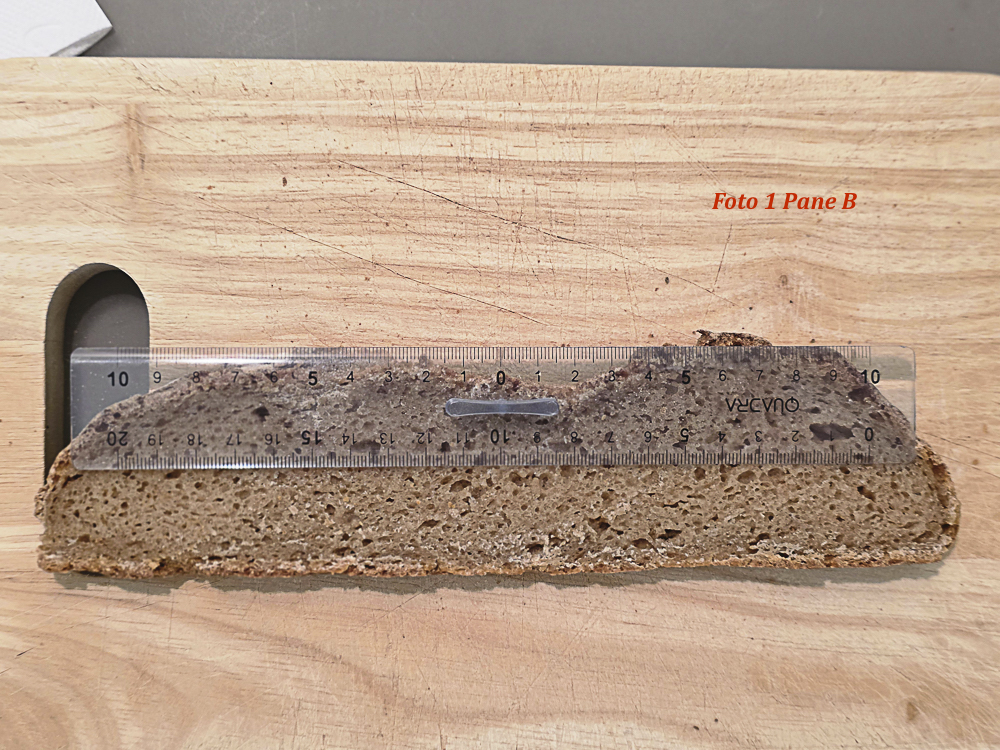
Foto 2 Pane B – Sezione: struttura buona ma meno uniforme, con maggiore compattezza in alcune aree.
6. Risultati del pane cotto
6.1 Pane A
- Temperatura al centro: 95,8 °C;
- peso pane cotto a freddo: 1333 g;
- peso impasto: 1576 g;
- perdita di peso: 15,41%;
- dimensioni: diametro 24 cm; altezza 7,5 cm;
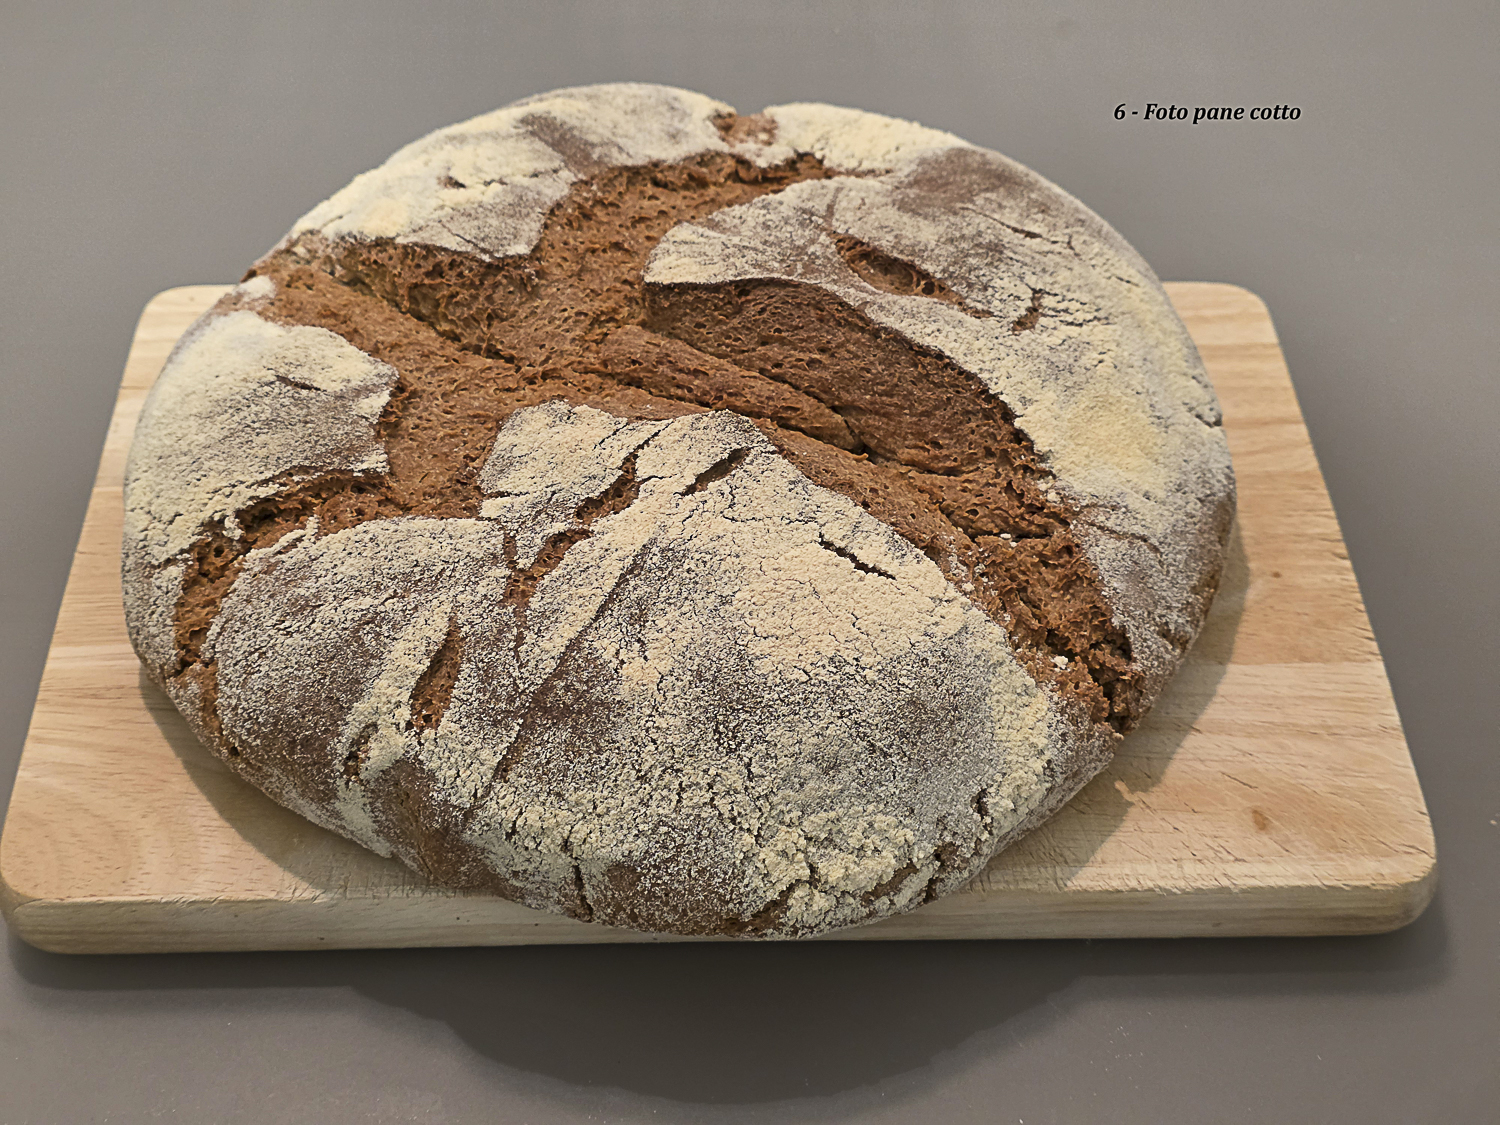
- apertura della crosta: eccellente;
- dilatazione laterale: ottima, con bordi caratterizzati da evidente spinta verso l’alto;
- profumo: consistente;
- sezione trasversale: ottima, con mollica più accentuata a sinistra e al centro, coerentemente con lo sviluppo laterale e verticale.
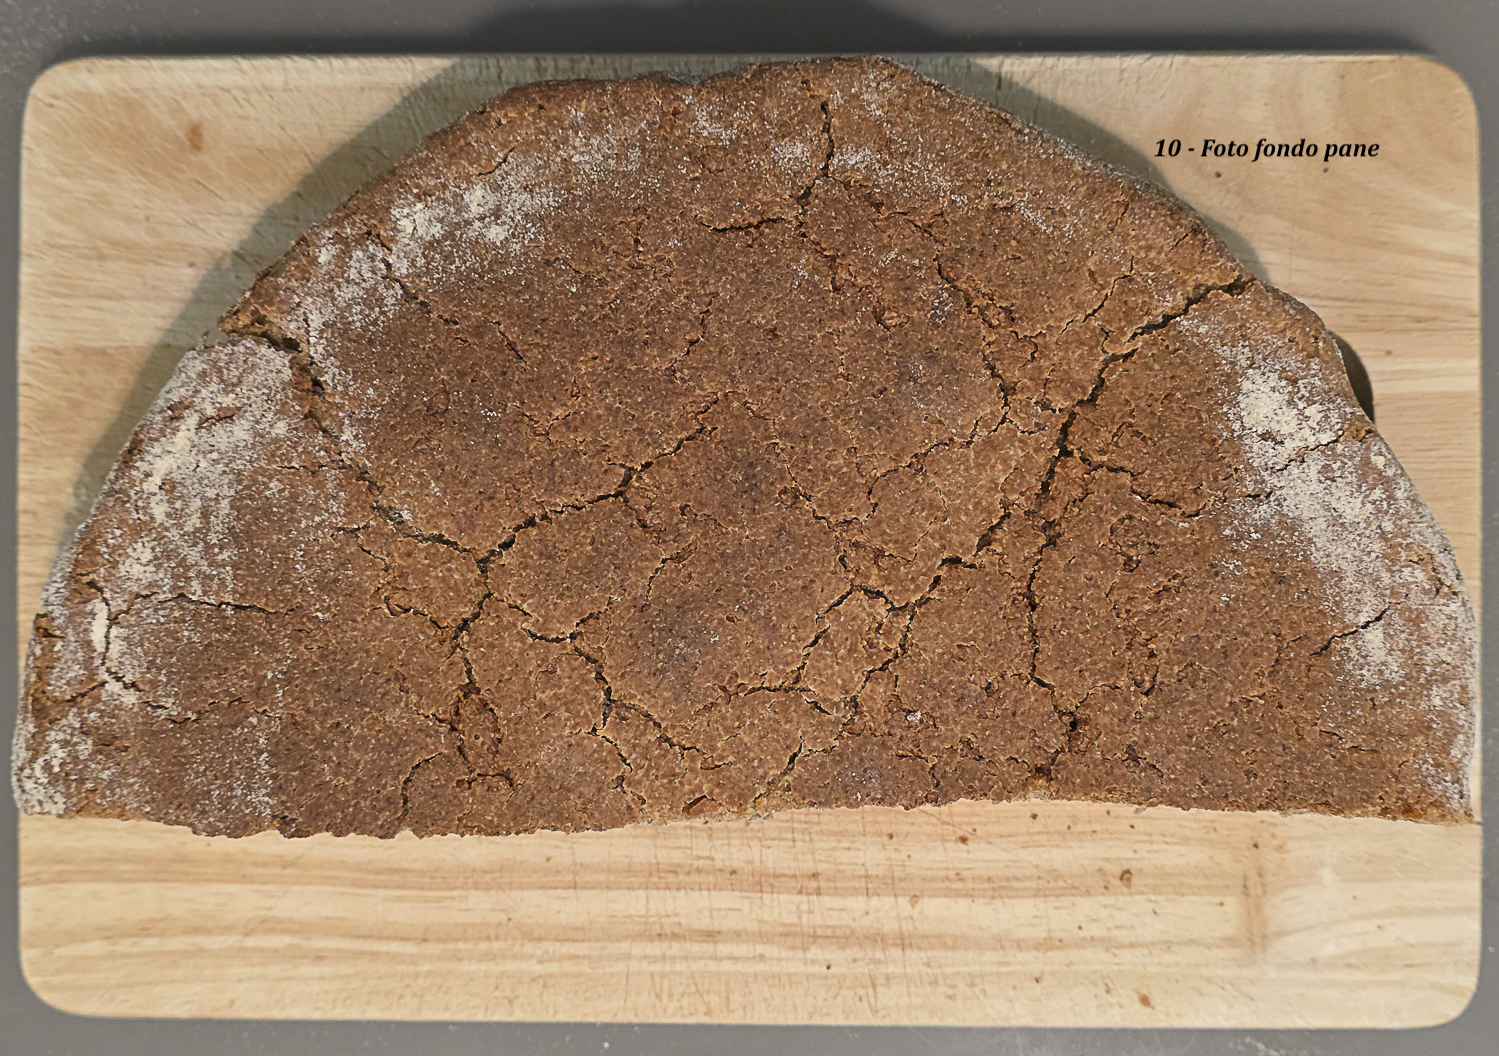
Foto 11 – Pane A: superficie e apertura della crosta, con dilatazione laterale evidente.
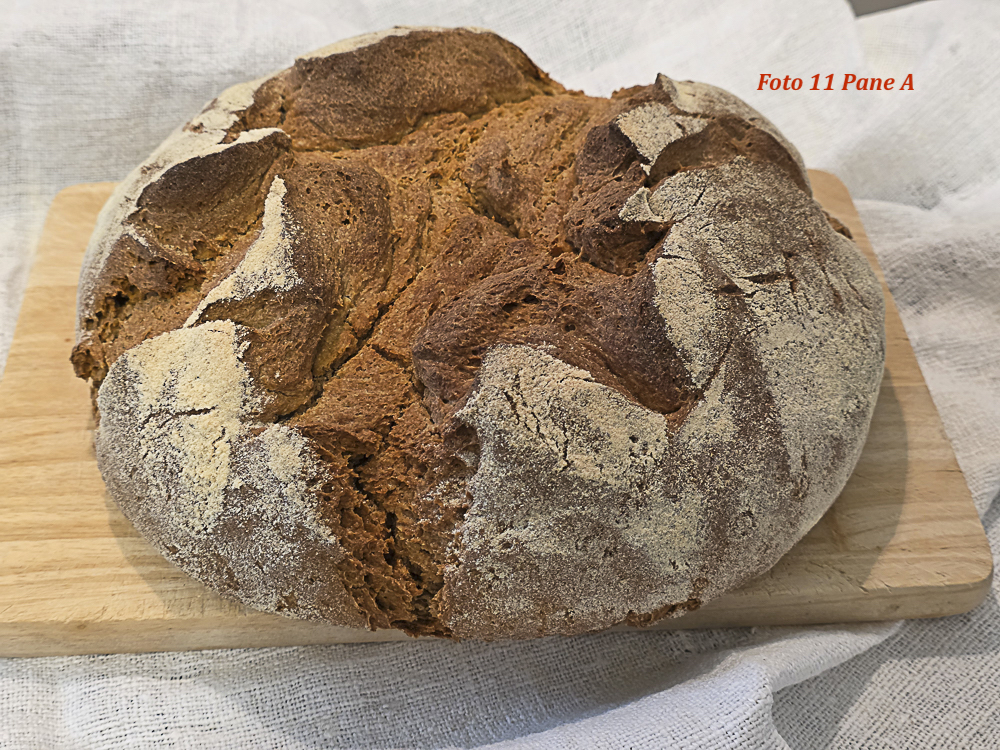
Foto 12 – Pane A: sezione trasversale con alveolatura fine-media e buona continuità strutturale.
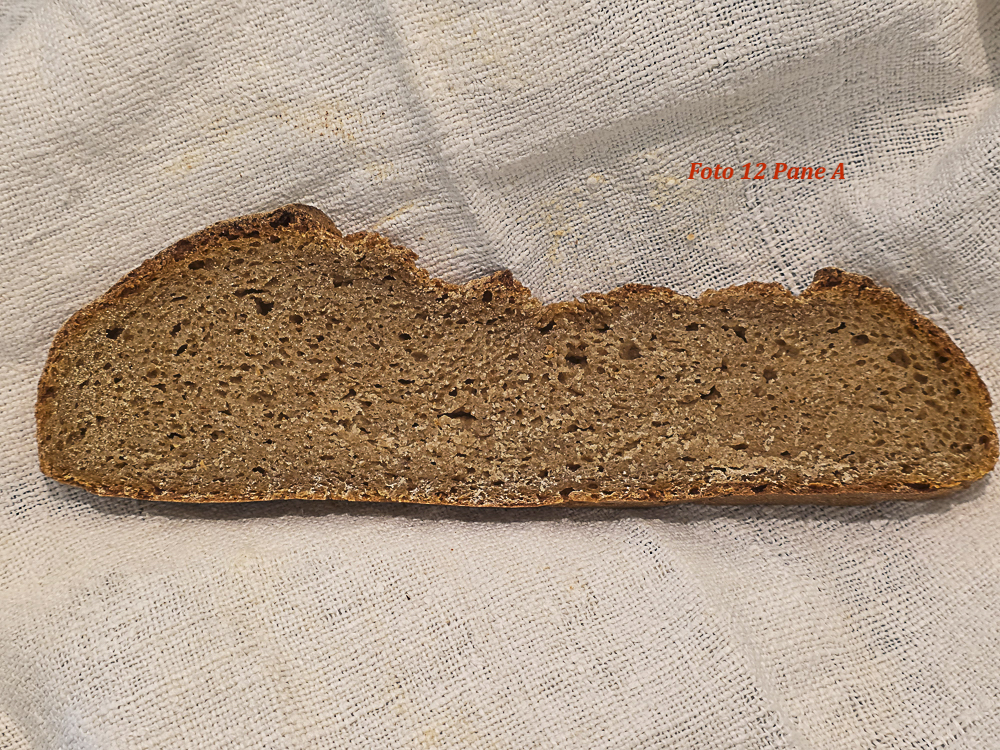
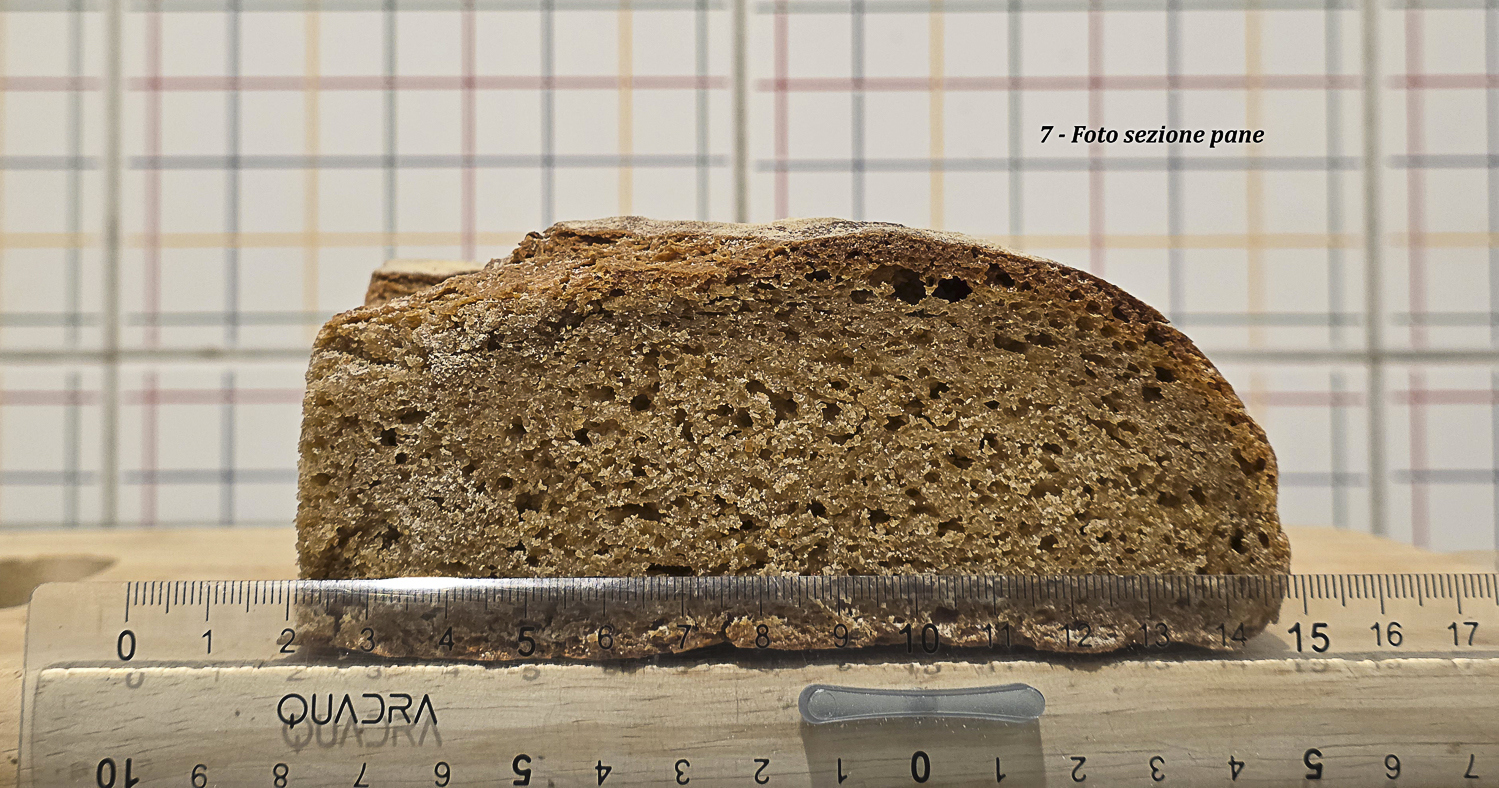
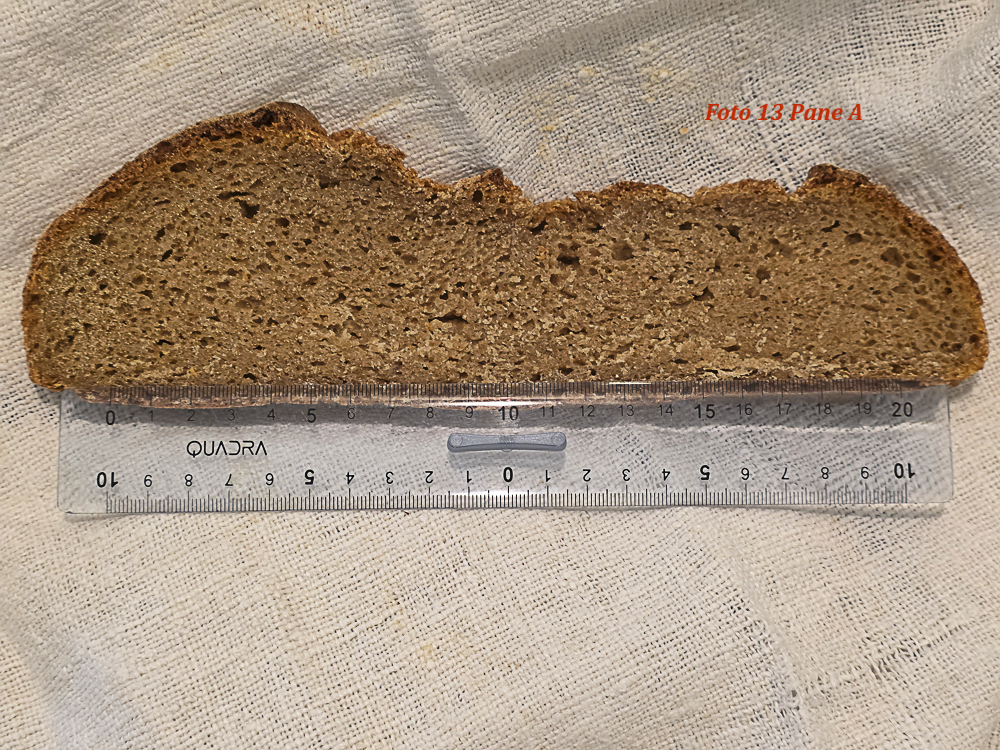
Foto 13 – Pane A: sezione con righello; altezza e sviluppo superiori rispetto a Pane B.
La Foto 11 evidenzia uno sviluppo esterno particolarmente significativo del Pane A. L’apertura della crosta non appare casuale o legata a una rottura disordinata della superficie, ma risulta coerente con una spinta espansiva interna ben direzionata. In particolare, nella zona sinistra del pane si osserva una marcata tendenza della massa a sollevarsi verso l’alto, segno che l’impasto, pur caratterizzato da una rete glutinica debole, ha mantenuto una sufficiente coesione interna durante la fase iniziale della cottura. La dilatazione laterale è accompagnata da una componente verticale evidente, soprattutto nella parte sinistra, indicando che la pressione dei gas non si è dispersa esclusivamente in senso orizzontale.
La Foto 13 conferma questa lettura anche nella sezione trasversale. La base del pane non appare compressa né schiacciata; al contrario, mostra una struttura continua, con alveolatura presente anche nella zona inferiore. Questo aspetto è rilevante perché negli impasti integrali deboli o molto viscosi la parte basale tende spesso a diventare più compatta per effetto del peso della massa e della limitata capacità di trattenere uniformemente i gas. Nel Pane A, invece, sotto la crosta non si osservano fenomeni anomali, zone dense marcate o separazioni strutturali. La mollica rimane coerente fino alla base, suggerendo che la spinta fermentativa e l’espansione in cottura abbiano coinvolto l’intera sezione del pane. Nel complesso, Foto 11 e Foto 13 indicano che il Pane A non ha soltanto avuto una buona apertura superficiale, ma ha conservato una struttura interna capace di sostenere una reale espansione tridimensionale: laterale, centrale e verticale. Questo conferma che il controllo più graduale della fase di riscaldamento ha favorito una migliore riorganizzazione dell’impasto prima dell’infornata, consentendo alla massa di arrivare in forno ancora sufficientemente coesa e reologicamente attiva.
6.2 Pane B
- Temperatura al centro: 96,6 °C;
- peso pane cotto a freddo: 1318 g;
- peso impasto in uscita da cella: 1563 g;
- perdita di peso: 15,6%;
- dimensioni: diametro 24 cm; altezza 6 cm;
- apertura della crosta: molto buona;
- dilatazione laterale: ottima, con bordi dotati di buona spinta verso l’alto;
- profumo: consistente;
- sezione trasversale: buona, ma condizionata dal mancato controllo ottimale della temperatura di lievitazione.
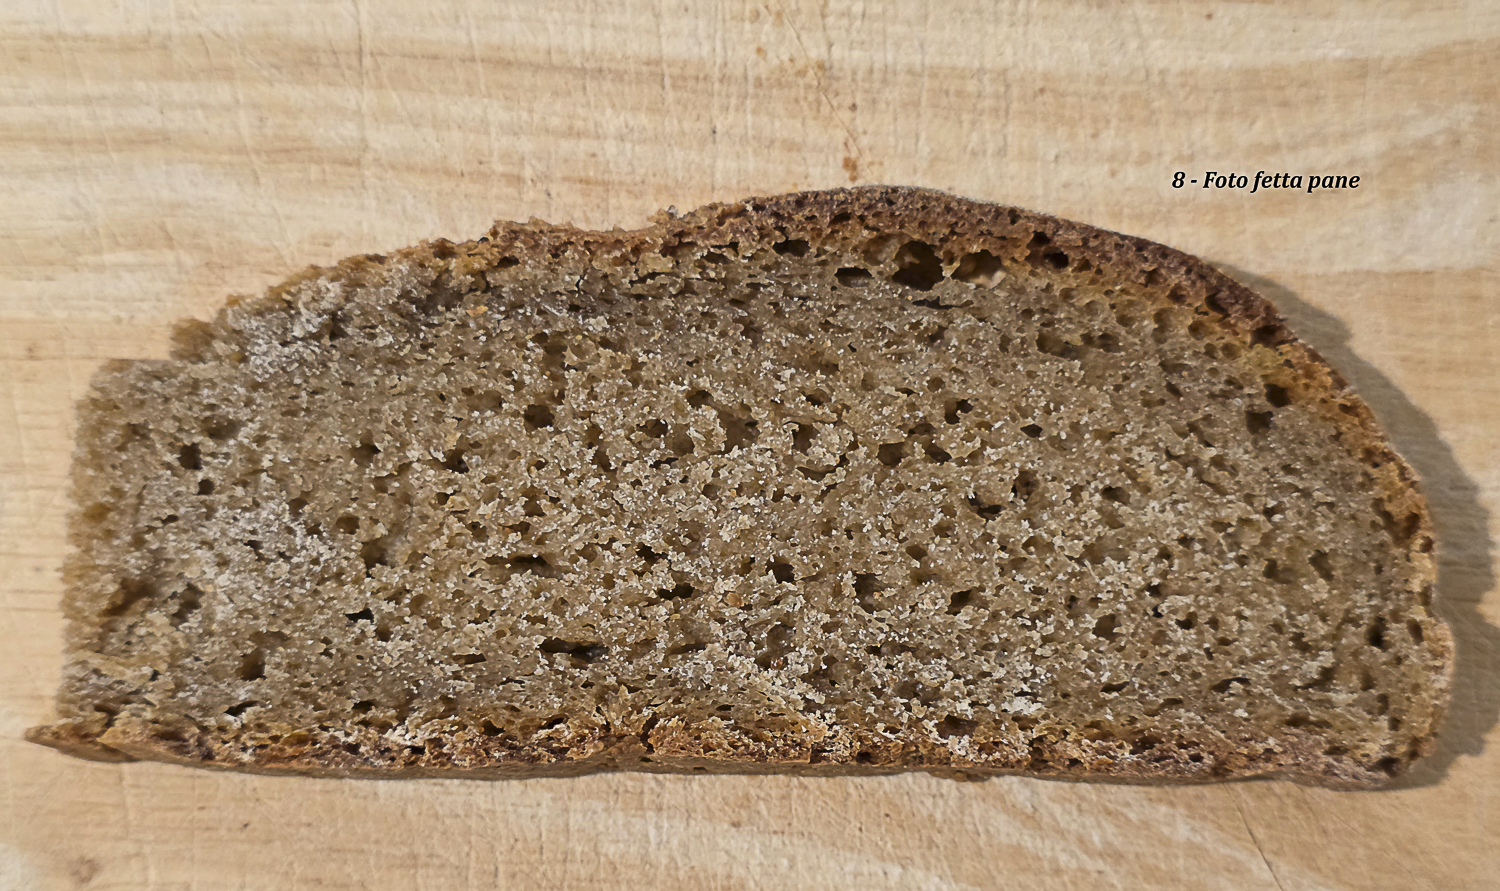
Foto 4 Pane B – Fetta: buona cottura e struttura complessivamente valida, ma minore sviluppo in altezza.
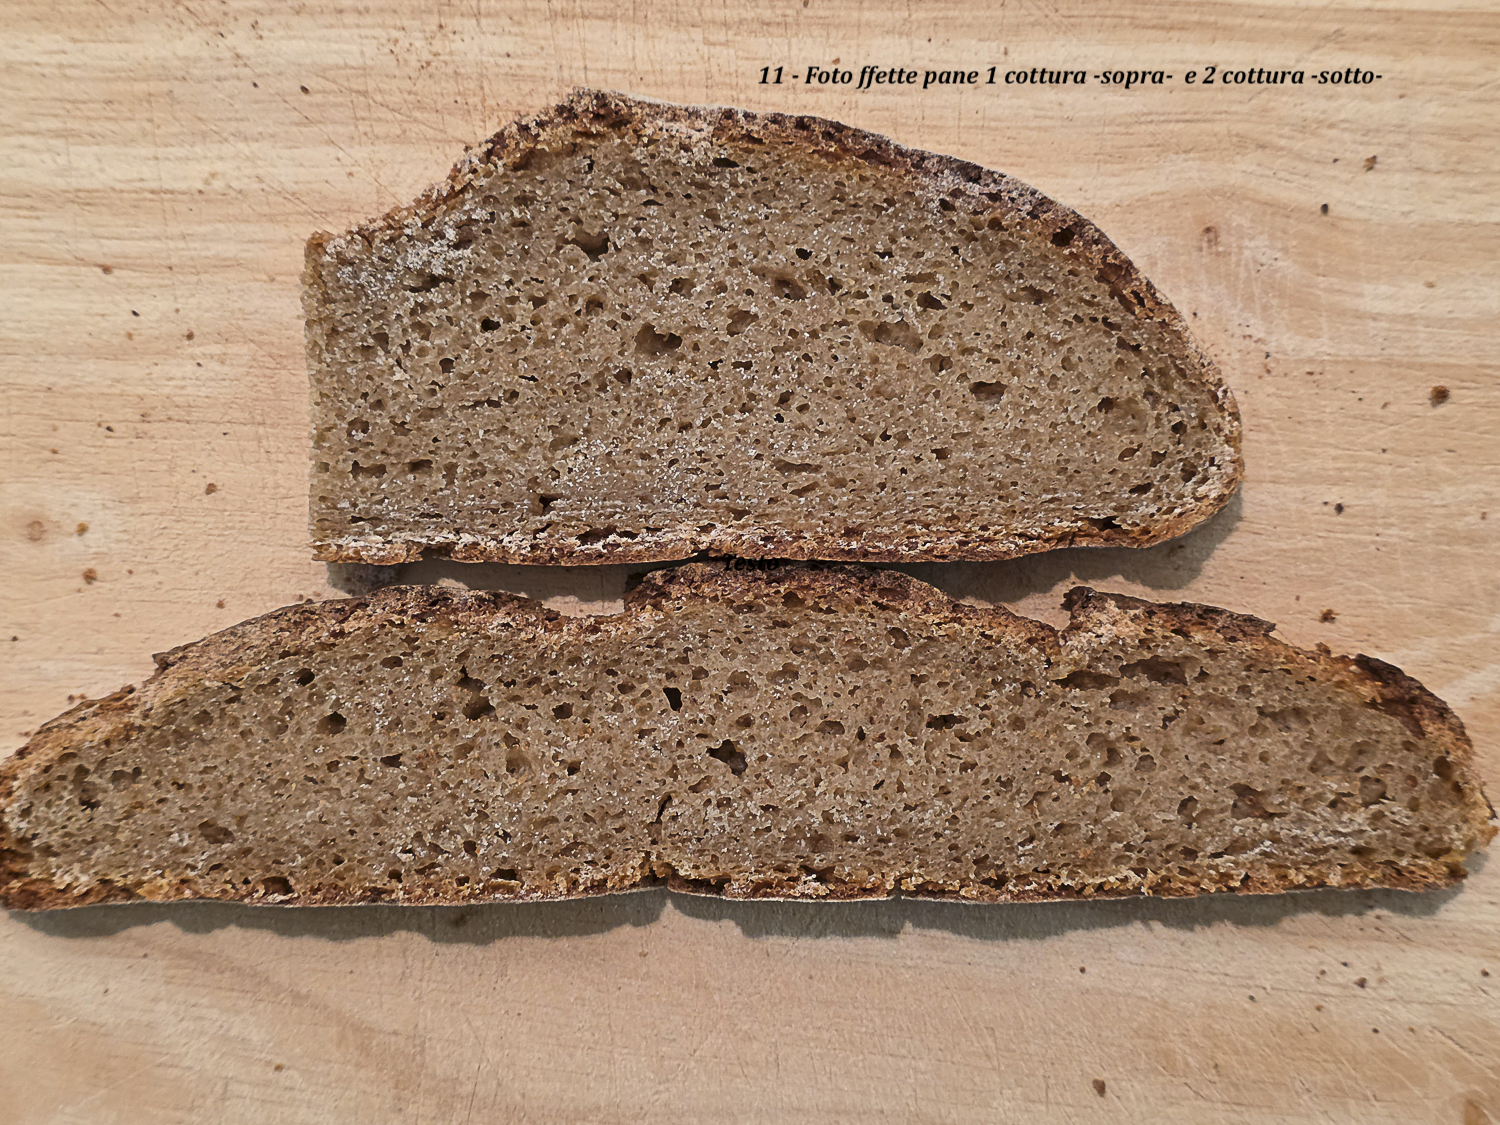
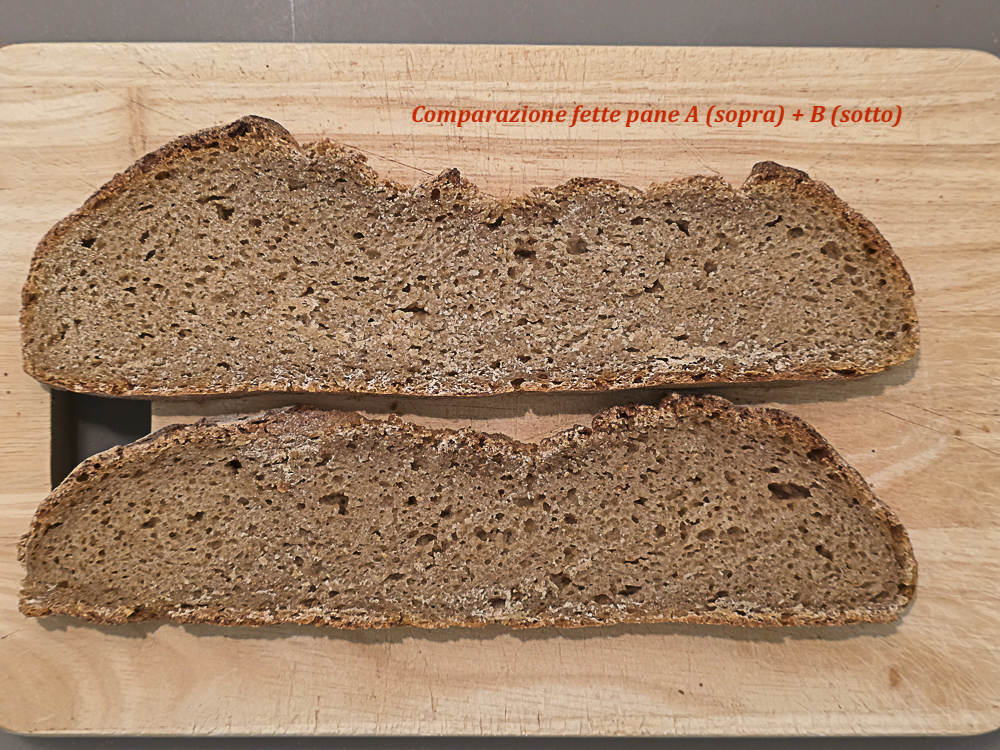
Comparazione delle fette: Pane A sopra, Pane B sotto. Si osservano differenze nella distribuzione della mollica e nello sviluppo.
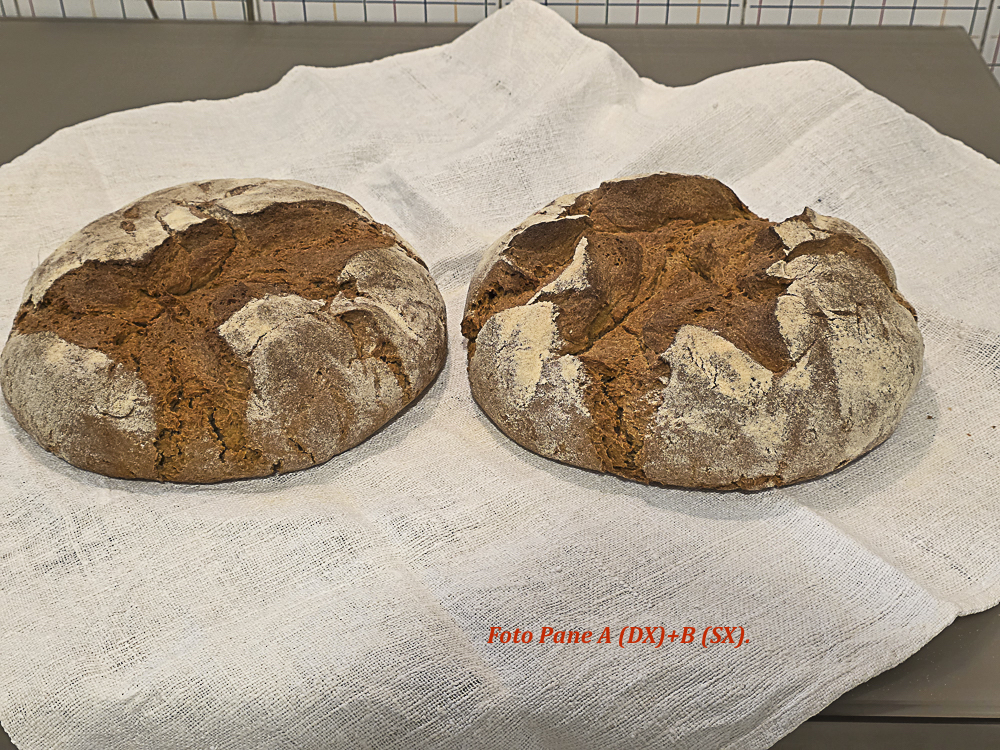
Confronto esterno Pane A e Pane B: differenza di sviluppo e geometria finale.
7. Confronto quantitativo tra Pane A e Pane B
| Parametro | Pane A | Pane B | Osservazioni comparative |
| Peso impasto | 1576 g | 1563 g | Pesi molto simili; confronto attendibile. |
| Peso pane cotto | 1333 g | 1318 g | Pane A leggermente superiore. |
| Perdita di peso | 15,41 % | 15,6 % | Perdita quasi equivalente. |
| Temperatura al centro a fine cottura | 95,8 °C | 96,6 °C | Entrambi cotti correttamente. |
| Diametro | 24 cm | 24 cm | Espansione laterale comparabile. |
| Altezza | 7,5 cm | 6 cm | Pane A mostra sviluppo verticale maggiore. |
| Apertura crosta | Eccellente | Molto buona | Apertura più netta e ampia nel Pane A. |
| Stato finale prima del forno | Molto disomogenea con evidenti rotture ma senza collasso; impasto ancora sferico. | Molto disgregata. | Pane A conserva maggiore coerenza strutturale; Pane B risente del riscaldamento meno controllato. |
| Mollica | Ottima; mollica evidente, più accentuata a sinistra e al centro per effetto della dilatazione laterale. | Buona, ma condizionata dal mancato controllo della temperatura di lievitazione. | Pane A presenta struttura più stabile e sviluppo più favorevole; Pane B mostra risultato più debole. |
8. Analisi della fase di riscaldamento
Il test conferma che, negli impasti integrali di monococco, la fase compresa tra uscita dalla cella e infornata è decisiva. Non è sufficiente conoscere la temperatura media dell’impasto: occorre comprendere come il calore si distribuisce tra superficie, fondo e cuore della massa. Il sistema osservato presenta bassa diffusività termica, cioè una ridotta capacità di trasferire rapidamente il calore verso il centro. Questo comportamento è coerente con la natura viscoso-plastica dell’impasto e con la presenza di una frazione fibrosa dispersa.
Lo schiacciamento dell’impasto da circa 15 cm a circa 5 cm ha avuto un effetto positivo, perché ha ridotto lo spessore e migliorato la capacità del calore di entrare nella massa. Le manipolazioni intermedie e i capovolgimenti ogni 30 minuti hanno contribuito a ridurre il gradiente termico e a favorire una distribuzione più omogenea della temperatura.
Nel Pane A il recupero termico è avvenuto in modo più progressivo. Nel Pane B, invece, l’aumento della temperatura è risultato più rapido e meno controllato. Questo ha determinato una condizione di maggiore instabilità al termine della lievitazione, con superficie molto disgregata prima dell’infornata.
9. Transizione termico-reologica
Il risultato più importante del test è l’identificazione di una finestra critica di transizione termico-reologica, collocabile indicativamente tra 18 °C e 22 °C. In questa fascia l’impasto passa da una massa fredda, compatta e relativamente rigida a una massa più morbida, fermentativamente attiva e deformabile. Questo passaggio non è neutro: se avviene gradualmente, la struttura può riorganizzarsi; se avviene troppo rapidamente, la superficie e la rete interna possono perdere coerenza.
Pane A attraversa questa finestra in modo più controllato. La superficie mostra rotture, ma la struttura interna continua a sostenere la massa e consente un buono sviluppo finale. Pane B attraversa la stessa finestra in modo più rapido; la superficie diventa molto disomogenea e poi disgregata, con riduzione dello sviluppo verticale finale.
Questo comportamento suggerisce che la qualità finale non dipenda esclusivamente dalla forza del glutine, ma dalla capacità dell’impasto di attraversare la fase di transizione senza perdere continuità strutturale. Nei sistemi a rete glutinica debole, come il monococco integrale, tale continuità è garantita da un equilibrio tra viscosità, idratazione, fase proteica e particelle fibrose.
10. Osservazioni sulla lavorabilità dell’impasto
Durante le prime due ore su piano caldo l’impasto mantiene una buona resistenza alla manipolazione. Non si osservano rotture importanti; al contrario, la massa passa gradualmente da uno stato compatto a uno stato più morbido. Dopo circa due ore la struttura appare più lavorabile e meno rigida. Pane A mantiene una lavorabilità migliore anche nella fase successiva; Pane B, invece, dopo due ore inizia a mostrare maggiore fragilità.
La valutazione manuale conferma che la manipolazione dell’impasto rappresenta uno strumento utile per interpretare la reologia dei sistemi farinacei complessi. Adesività, resistenza alla deformazione, tensione superficiale e capacità di mantenere forma forniscono informazioni che completano i dati termici e fotografici [Dobraszczyk & Morgenstern, 2003].
11. Lievitazione nel cestino e stabilità finale
Entrambi gli impasti hanno mostrato crescita nel cestino, ma Pane A ha evidenziato una lievitazione più convincente. La forma è stata mantenuta in entrambi i casi grazie al contenimento del cestino, ma Pane B è arrivato alla fase di pre-infornata in condizioni più compromesse, con superficie molto disgregata. Nonostante ciò, non si è verificato collasso completo e l’apertura in forno è risultata presente in entrambi i pani.
Questo dato è importante: anche quando la superficie si rompe, la struttura interna può continuare a trattenere gas se la massa conserva una sufficiente coerenza. Tuttavia la qualità dello sviluppo finale dipende da quanto questa coerenza è conservata. Pane A, meno compromesso nella fase finale, sviluppa 7,5 cm di altezza; Pane B si ferma a 6 cm.
Il comportamento dell’impasto può essere rappresentato come una relazione tra temperatura e stato reologico osservato.
12. Analisi della mollica
La mollica di Pane A presenta una struttura fine-media, con distribuzione degli alveoli relativamente uniforme e buona partecipazione anche delle zone inferiori della sezione (Foto 8 e 9).
Si osserva uno sviluppo più marcato nella zona sinistra e centrale, coerente con la maggiore dilatazione laterale e con la spinta verso l’alto dei bordi (Foto 12 e 13). La mollica appare coerente, non massivamente compatta e priva di cavità anomale.
Pane B presenta una struttura complessivamente buona, ma meno uniforme. Il minore sviluppo in altezza e la disgregazione osservata prima dell’infornata indicano che la spinta fermentativa non è stata distribuita con la stessa efficacia. La mollica risente quindi del controllo termico meno preciso, più che di una differenza sostanziale di impasto iniziale.
Il confronto tra le fette suggerisce che Pane A abbia distribuito meglio la pressione dei gas all’interno della massa, mentre Pane B abbia subito una localizzazione della deformazione e una riduzione della capacità di sviluppo verticale. Questo conferma l’importanza della fase di riscaldamento come parametro tecnico autonomo.
13. Interpretazione fisica del comportamento dell’impasto
I risultati sperimentali possono essere interpretati considerando l’interazione tra struttura proteica debole, frazione fibrosa e diffusione termica. Il monococco integrale genera impasti nei quali la rete proteica non si comporta come una struttura elastica robusta, ma come una matrice viscoso-plastica capace di deformarsi e riorganizzarsi se le condizioni termiche e meccaniche sono favorevoli.
La granulometria della crusca agisce sulla viscosità perché modifica la superficie specifica della frazione solida. Particelle molto fini assorbono più acqua, aumentano la viscosità della fase continua e interferiscono maggiormente con la continuità della rete proteica. Particelle più grossolane riducono questa interferenza e possono migliorare la lavorabilità e la distribuzione della deformazione [Noort et al., 2010; Cappelli et al., 2019].
Il test di conferma aggiunge però un elemento decisivo: anche con una farina riorganizzata e una granulometria favorevole, la riuscita dipende dalla velocità con cui il calore entra nella massa. Se il riscaldamento è graduale, come nel Pane A, l’impasto attraversa la transizione reologica e si riorganizza. Se il riscaldamento è più rapido e meno controllato, come nel Pane B, la struttura può arrivare alla fase di cottura già indebolita.
14. Ruolo della granulometria della crusca
Il presente test conferma la rilevanza della granulometria della frazione cruscale, ma ne precisa il ruolo. La crusca grossolana non agisce da sola come fattore risolutivo; piuttosto, crea condizioni più favorevoli affinché l’impasto possa essere gestito nella fase critica. Riducendo l’eccesso di viscosità e l’assorbimento competitivo dell’acqua, la frazione grossolana consente una migliore deformabilità. Tuttavia, se il gradiente termico non è controllato, anche un impasto potenzialmente favorevole può perdere coerenza superficiale e sviluppare meno.
In questo senso il risultato più importante non è semplicemente che il cruschello grossolano migliora l’impasto, ma che la granulometria e la dinamica termica devono essere considerate insieme. La struttura finale del pane deriva dall’interazione tra composizione, distribuzione dell’acqua, viscosità, temperatura e manipolazione.
15. Sequenza reologica confermata
Il test permette di individuare una sequenza operativa e reologica ripetibile:
- impasto freddo ma stabile dopo maturazione;
- schiacciamento per ridurre lo spessore e migliorare lo scambio termico;
- riscaldamento graduale su piano caldo;
- manipolazioni intermedie per ridurre il gradiente termico;
- passaggio da massa compatta a massa più morbida e deformabile;
- mantenimento della coerenza strutturale nonostante rotture superficiali;
- tenuta nel cestino;
- apertura spontanea in forno;
- formazione di mollica fine-media, più o meno uniforme a seconda del controllo termico.
Questa sequenza è particolarmente significativa perché mostra che un impasto di monococco integrale, pur debole dal punto di vista glutinico, può essere guidato verso una struttura finale soddisfacente se la transizione termico-reologica viene gestita con gradualità.
16. Sintesi interpretativa finale
L’insieme delle osservazioni visive, delle misurazioni termiche, delle valutazioni manuali e dei risultati sul pane cotto suggerisce che la riuscita degli impasti integrali di monococco dipenda da due variabili principali: granulometria della frazione cruscale e controllo della fase di riscaldamento. La prima modula la viscosità e la disponibilità dell’acqua; la seconda determina se la struttura ha il tempo di riorganizzarsi durante la fase critica.
Pane A rappresenta l’esito più favorevole del test: riscaldamento più progressivo, maggiore stabilità, migliore sviluppo in altezza, apertura crosta eccellente e mollica più uniforme. Pane B, pur ottenendo un risultato complessivamente buono, evidenzia gli effetti negativi di un aumento termico meno controllato: superficie molto disgregata prima dell’infornata, minore altezza finale e struttura della mollica meno regolare.
Il test conferma quindi che la fase compresa tra uscita dalla cella e forno non è una semplice fase di attesa, ma una fase tecnologica decisiva. In questa fase si determina la capacità dell’impasto di passare da stato freddo e compatto a stato caldo, espanso e strutturalmente coerente.
17. Conclusioni
Il test di conferma del 22-04-2026 consente di formulare alcune conclusioni operative e interpretative:
- la granulometria della frazione cruscale resta un parametro tecnologico rilevante negli impasti integrali di monococco;
- la fase di riscaldamento post-maturazione è altrettanto decisiva e deve essere controllata con attenzione;
- la finestra tra circa 18 °C e 22 °C appare critica per la transizione reologica dell’impasto;
- un riscaldamento graduale consente alla rete debole di riorganizzarsi e mantenere coerenza;
- un riscaldamento troppo rapido può determinare disgregazione superficiale e minore sviluppo finale;
- la misura della sola temperatura media non è sufficiente: occorre monitorare superficie, cuore e, quando possibile, fondo;
- lo schiacciamento dell’impasto e le manipolazioni intermedie sono strumenti utili per migliorare la diffusione del calore;
- Pane A conferma la validità del protocollo quando la dinamica termica è controllata;
- Pane B mostra il limite del sistema quando la transizione viene attraversata troppo rapidamente.
La qualità finale del pane non dipende esclusivamente dalla composizione dell’impasto, ma dalla capacità di attraversare in modo controllato la fase di transizione termico-reologica, durante la quale la struttura dell’impasto passa da uno stato compatto a uno stato deformabile e deve successivamente riorganizzarsi per mantenere la propria coerenza.
18. Modello interpretativo della transizione termico-reologica
18.1 Grafico: temperatura vs stato dell’impasto
Il comportamento dell’impasto può essere rappresentato come una relazione tra temperatura e stato reologico osservato.
Schema interpretativo
| Temperatura (°C) | Stato dell’impasto |
| 5–10 °C | massa fredda, compatta, stabile (post cella) |
| 10–16 °C | fase di transizione: aumento lavorabilità, struttura fragile |
| 16–20 °C | struttura in riorganizzazione, elasticità crescente |
| 20–23 °C | sviluppo attivo, espansione, tensione superficiale |
| >23 °C | rischio disgregazione (Pane B), perdita di controllo |
Interpretazione chiave
- Pane A: attraversa gradualmente tutte le fasi
- Pane B: entra troppo rapidamente nella zona >20°C → perdita di controllo
Questo grafico è il cuore del test: collega temperatura a comportamento reale.
18.2 Schema: distribuzione termica (sopra / dentro)
| Fase | Distribuzione termica | Interpretazione |
| FASE 1 – Uscita da cella | Sopra: 5 °C
Dentro: 2–4 °C |
Forte gradiente termico |
| FASE 2 – Riscaldamento su piano caldo | Sotto ↑↑ (non misurato ma implicito)
Sopra ↑ Dentro ↑ lento |
Disomogeneità strutturale |
| FASE 3 – Omogeneizzazione (pieghe + tempo) | Sopra ≈ Dentro | Struttura più stabile |
| FASE 4 – Pre-inforno (Pane A) | Dentro > Sopra | Attivazione interna → buona spinta |
| Pane B | Sopra e dentro salgono troppo velocemente insieme | Perdita di controllo reologico |
Concetto chiave
La qualità finale del pane dipende non solo dalla temperatura assoluta, ma dalla dinamica di distribuzione del calore all’interno della massa.
18.3 Concetto chiave: “Finestra di transizione reologica”
La “finestra di transizione reologica” è l’intervallo di temperatura nel quale l’impasto passa da uno stato meccanicamente stabile ma rigido a uno stato plastico, lavorabile e capace di sviluppare struttura senza perdere coesione.
Esiste una finestra ampia di transizione compresa tra circa 14 e 22 °C, con una fascia critica principale tra 18 e 22 °C.
Comportamento osservato
Pane A
- attraversa lentamente la finestra
- permette riorganizzazione della rete
- risultato: struttura stabile + buona espansione
Pane B
- attraversa troppo rapidamente la finestra
- struttura non si stabilizza
- risultato: impasto disgregato + minore sviluppo
Formula sintetica
Non è la temperatura finale a determinare il risultato, ma come l’impasto attraversa la finestra di transizione reologica.
Sintesi finale
Questo test dimostra che:
- Il monococco integrale è un sistema termicamente lento e reologicamente sensibile
- Il controllo della velocità di riscaldamento è più importante del valore finale
- La granulometria della crusca interagisce con:
- viscosità
- distribuzione del calore
- stabilità strutturale
- Esiste una finestra critica (14–20°C) in cui si gioca il risultato finale
19. Prospettive di ricerca
I risultati suggeriscono l’opportunità di ulteriori prove sistematiche sulla relazione tra granulometria della crusca, idratazione, spessore dell’impasto, temperatura del piano caldo e durata della fase di riscaldamento. In particolare sarebbe utile rilevare anche la temperatura della parte inferiore dell’impasto, a contatto con il piano caldo, per valutare con maggiore precisione il gradiente termico completo. Inoltre dovrà essere approfondita la relazione tra tempo maturazione in cella ed effetti sulla tenuta dell’impasto: quanto influisce la durata della fase in cella sulla tenuta dell’impasto?
Questo punto dovrà essere verificato in relazione alla tenuta dell’impasto durante la fase di riscaldamento controllato della lievitazione: questa fase è probabile abbia un impatto più significativo, rispetto alla permanenza in cella, sulla tenuta dell’impasto.
Infine, è opportuno controllare con maggiore precisione la temperatura interna dell’impasto durante la permanenza in cella, poiché la maturazione microbiologica non dipende solo dalla durata della sosta, ma anche dall’effettiva temperatura raggiunta nel cuore della massa. La temperatura condiziona l’attività dei batteri lattici, la velocità di acidificazione e il rapporto tra acido lattico e acido acetico, influenzando indirettamente la struttura e la tenuta reologica dell’impasto [De Vuyst & Neysens, 2005]. L’acidificazione, a sua volta, modifica le proprietà reologiche della matrice proteica e può incidere sulla tenuta dell’impasto e sullo sviluppo finale del pane [Arendt et al., 2007].
Un ulteriore sviluppo potrebbe consistere nella costruzione di una curva temperatura-tempo associata agli stati visivi dell’impasto, distinguendo le fasi di massa compatta, massa morbida, comparsa di rotture, disgregazione superficiale e stabilizzazione. Questo permetterebbe di definire una vera finestra operativa di sicurezza per la lievitazione degli impasti integrali di monococco.
L’osservazione potrebbe avere interesse anche per altri sistemi panari caratterizzati da impasti viscoso-plastici, inclusi alcuni sistemi gluten free, nei quali la struttura dipende in misura significativa dall’interazione tra fase liquida, particelle solide disperse e agenti strutturanti.
20. Studi scientifici di riferimento
1. Effetto della granulometria della crusca sulla qualità del pane
Noort M.W.J., van Haaster D., Hemery Y., Schols H., Hamer R. (2010). The effect of particle size of wheat bran fractions on bread quality. Journal of Cereal Science. DOI: 10.1016/j.jcs.2010.04.008
Lo studio analizza l’influenza della dimensione delle particelle di crusca sulle proprietà reologiche dell’impasto e sulla qualità del pane. Le particelle più fini aumentano l’assorbimento d’acqua e la viscosità; quelle più grossolane interferiscono meno con la rete glutinica e possono consentire uno sviluppo più regolare.
2. Dimensione delle particelle della farina integrale e qualità del pane
Cappelli A., Oliva N., Cini E. (2019). A systematic review of the influence of whole wheat flour particle size on bread characteristics. Journal of Cereal Science. DOI: 10.1016/j.jcs.2019.102790
La revisione mostra che la riduzione della granulometria aumenta la superficie specifica della fibra e la capacità di assorbimento dell’acqua, con conseguente incremento della viscosità e possibile peggioramento della lavorabilità.
3. Struttura e funzione delle proteine del glutine
Shewry P.R., Halford N.G. (2002). Cereal seed storage proteins: structures, properties and role in grain utilization. Biochemical Society Transactions. DOI: 10.1042/BST0300118
Il lavoro descrive il ruolo delle gliadine e delle glutenine nella formazione della struttura dell’impasto. Le gliadine contribuiscono principalmente a viscosità ed estensibilità, mentre le glutenine sostengono la componente elastica.
4. Chimica delle proteine del glutine
Wieser H. (2007). Chemistry of gluten proteins. Food Microbiology. DOI: 10.1016/j.fm.2006.07.004
Il lavoro è utile per interpretare la formazione e la riorganizzazione della rete proteica, in particolare nei sistemi dove la componente elastica è limitata.
5. Fermentazione e maturazione dell’impasto
Gobbetti M., De Angelis M., Di Cagno R. (2014). Sourdough fermentation and wheat bread quality. Trends in Food Science & Technology. DOI: 10.1016/j.tifs.2014.02.012
Il lavoro descrive gli effetti della fermentazione prolungata sulle proteine, sull’attività enzimatica e sulla qualità finale del pane.
6. Reologia e processo di panificazione
Dobraszczyk B.J., Morgenstern M.P. (2003). Rheology and the breadmaking process. Journal of Cereal Science. DOI: 10.1016/S0733-5210(03)00059-6
Lo studio evidenzia l’importanza della valutazione reologica dell’impasto e il ruolo della percezione manuale nelle fasi operative della panificazione.
21. Appendice A – Dati tecnici di formulazione
Per correntezza di lettura si riportano i dati relativi al preimpasto ed impasto del precedente test n. 3 che sono identici a quelli usati nel presente test n. 4.
[1] La materia prima utilizzata nel test del 10-04-2026 è costituita da farina integrale di grano monococco macinata a pietra per una quantità totale di 1800 g.
La farina è stata interamente setacciata con maglia da 500 µm, ottenendo:
- 146 g di frazione cruscale
- 1654 g di farina passante
La frazione cruscale separata è stata successivamente sostituita con pari peso di crusca più grossolana, con granulometria compresa tra 800 e 600 µm, ricostituendo così 1800 g di farina integrale riorganizzata.
La distribuzione della farina nelle diverse fasi del processo è stata la seguente:
- Impasto finale: 1000 g di farina integrale riorganizzata
- Preimpasto (biga): 800 g di farina integrale riorganizzata
[2] Preimpasto: 800gr. di farina riorganizzata; 180 gr. LiCoLi di monococco; 3gr. lievito di birra compresso; 350gr. acqua
[3] Impasto: preimpasto pronto; 4gr. lievito di birra compresso; 72gr. olio extravergine di oliva; 30gr. Sale; 22gr, malto di orzo; 660gr. Acqua.
22. Bibliografia
- Shewry P.R., Halford N.G. (2002). Cereal seed storage proteins: structures, properties and role in grain utilization. Biochemical Society Transactions. DOI: 10.1042/BST0300118
- Wieser H. (2007). Chemistry of gluten proteins. Food Microbiology. DOI: 10.1016/j.fm.2006.07.004
- Noort M.W.J., van Haaster D., Hemery Y., Schols H., Hamer R. (2010). The effect of particle size of wheat bran fractions on bread quality. Journal of Cereal Science. DOI: 10.1016/j.jcs.2010.04.008
- Cappelli A., Oliva N., Cini E. (2019). A systematic review of the influence of whole wheat flour particle size on bread characteristics. Journal of Cereal Science. DOI: 10.1016/j.jcs.2019.102790
- Gobbetti M., De Angelis M., Di Cagno R. (2014). Sourdough fermentation and wheat bread quality. Trends in Food Science & Technology. DOI: 10.1016/j.tifs.2014.02.012
- Dobraszczyk B.J., Morgenstern M.P. (2003). Rheology and the breadmaking process. Journal of Cereal Science. DOI: 10.1016/S0733-5210(03)00059-6
- Pomeranz Y., Shogren M.D., Finney K.F., Bechtel D.B. (1977). Fiber in breadmaking – effects on gluten structure. Cereal Chemistry.
- Brandolini A., Hidalgo A. (2011). Nutritional value of einkorn wheat. Journal of the Science of Food and Agriculture. DOI: 10.1002/jsfa.4462
- Singh R.P., Heldman D.R. (2014). Introduction to Food Engineering. Academic Press.